Back in 2003, the UK government carried out a survey. And it was a survey that measured levels of numeracy in the population. And they were shocked to find out that for every 100 working age adults in the country, 47 of them lacked Level 1 numeracy skills. Now, Level 1 numeracy skills -- that's low-end GCSE score. It's the ability to deal with fractions, percentages and decimals. So this figure prompted a lot of hand-wringing in Whitehall. Policies were changed, investments were made, and then they ran the survey again in 2011. So can you guess what happened to this number? It went up to 49.
지난 2003년 영국 정부는 조사를 하나 했습니다. 바로 사람들의 계산능력을 단계별로 평가하는 조사였습니다. 결과는 충격적이었습니다. 노동 가능한 나이의 인구 100명 당 47명이 1단계도 충족하지 못했거든요. 여기서 계산능력 1단계란 GCSE 점수 중 최하입니다. 분수, 백분율, 소수만 다룰 줄 아는 거죠. 이 결과에 영국 정부는 발벗고 나섰습니다. 정책을 바꾸고 투자도 했죠. 그리고 2011년에 조사를 다시 했습니다. 그 결과는 어땠을까요? 오히려 49로 올랐습니다.
(Laughter)
(웃음)
And in fact, when I reported this figure in the FT, one of our readers joked and said, "This figure is only shocking to 51 percent of the population."
그리고 제가 이 결과를 FT에 보고했을 때 누가 읽고 농담을 던졌습니다. "나머지 51%한테나 충격이겠지."
(Laughter)
(웃음)
But I preferred, actually, the reaction of a schoolchild when I presented at a school this information, who raised their hand and said, "How do we know that the person who made that number isn't one of the 49 percent either?"
제일 맘에 든 것은 한 학생의 반응이었습니다. 학교에 이 사실을 알렸더니 학생 하나가 손을 들더니 말했습니다. "그 결과를 낸 사람이 49%에 속하면 어떡해요?"
(Laughter)
(웃음)
So clearly, there's a numeracy issue, because these are important skills for life, and a lot of the changes that we want to introduce in this century involve us becoming more comfortable with numbers.
분명한건 계산능력 문제가 존재한다는 거죠. 살아가는 데 있어 중요한 기술이고 앞으로 우리가 변화를 이루어내려면 반드시 숫자를 잘 다룰 줄 알아야 하니까요.
Now, it's not just an English problem. OECD this year released some figures looking at numeracy in young people, and leading the way, the USA -- nearly 40 percent of young people in the US have low numeracy. Now, England is there too, but there are seven OECD countries with figures above 20 percent. That is a problem, because it doesn't have to be that way. If you look at the far end of this graph, you can see the Netherlands and Korea are in single figures. So there's definitely a numeracy problem that we want to address.
이것은 영국만의 문제가 아닙니다. 올해 OECD는 젊은이들의 계산능력 조사 결과를 발표했습니다. 먼저, 미국의 경우 40% 정도가 낮은 계산능력을 보였습니다. 영국도 마찬가지입니다. 이외 7개 국가가 20% 이상을 기록했습니다. 문제가 있는 겁니다. 그럴 필요가 없으니까요. 이 그래프의 끝을 보시면 네덜란드와 한국은 수치가 한자리입니다. 우리는 확실히 문제가 있는 셈이죠.
Now, as useful as studies like these are, I think we risk herding people inadvertently into one of two categories; that there are two kinds of people: those people that are comfortable with numbers, that can do numbers, and the people who can't. And what I'm trying to talk about here today is to say that I believe that is a false dichotomy. It's not an immutable pairing. I think you don't have to have tremendously high levels of numeracy to be inspired by numbers, and that should be the starting point to the journey ahead.
이런 연구가 뚜렷이 보여주듯 우리는 사람들을 두개의 항목 중 하나에 몰아넣고 있습니다. 바로 사람을 나누는 두 가지의 기준이 있죠. 숫자에 익숙하고 계산을 잘 하는 사람 그리고 그렇지 못한 사람. 제가 오늘 말씀드리려 하는 것은 바로 이 이분법의 무용함입니다. 이건 불변의 것이 아닙니다. 저는 숫자를 유용하게 쓰려고 몹시 뛰어난 계산능력을 지닐 필요는 없다고 생각합니다. 그리고 여기부터 여정을 시작해야 합니다.
And one of the ways in which we can begin that journey, for me, is looking at statistics. Now, I am the first to acknowledge that statistics has got somewhat of an image problem.
그 여행을 시작하려면 우선 통계를 살펴봐야 합니다. 인정하자면, 통계학은 이미지 문제가 있습니다.
(Laughter)
(웃음)
It's the part of mathematics that even mathematicians don't particularly like, because whereas the rest of maths is all about precision and certainty, statistics is almost the reverse of that. But actually, I was a late convert to the world of statistics myself. If you'd asked my undergraduate professors what two subjects would I be least likely to excel in after university, they'd have told you statistics and computer programming, and yet here I am, about to show you some statistical graphics that I programmed.
통계학은 수학의 한 분야인데 수학자들도 별로 좋아하지 않습니다. 왜냐면 수학은 대체로 적확과 확실성의 학문인데 통계학은 그 반대거든요. 그렇지만 저는 뒤늦게 통계학에 빠졌습니다. 제 학부시절 교수님께 제가 졸업 후 가장 못할 것 같은 과목들이 무엇인지 물었을 때 아마 통계학과 프로그래밍이라고 대답하셨을 겁니다. 그렇지만 오늘 이자리에 제가 직접 프로그래밍한 통계를 들고 이렇게 서있습니다.
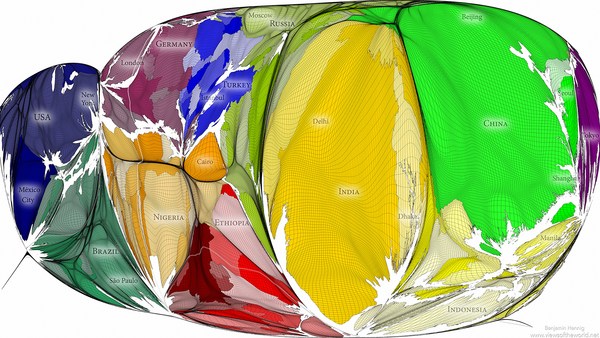
So what inspired that change in me? What made me think that statistics was actually an interesting thing? It's really because statistics are about us. If you look at the etymology of the word statistics, it's the science of dealing with data about the state or the community that we live in. So statistics are about us as a group, not us as individuals. And I think as social animals, we share this fascination about how we as individuals relate to our groups, to our peers. And statistics in this way are at their most powerful when they surprise us.
무엇이 저를 바꿨을까요? 왜 통계학에 흥미를 갖게 된 걸까요? 통계학은 바로 우리에 관한 학문이기 때문입니다. 통계학의 어원을 보면 통계학은 우리가 사는 세상의 상태 집단에 관한 데이터를 다루는 과학입니다. 즉, 통계학은 개인이 아닌 집단에 관한 것입니다. 그리고 저는 사회적 동물로서 우리는 개인으로서 집단에 속하는 것을 좋아한다고 생각합니다. 동지가 필요한 겁니다. 그래서 통계학은 우리에게 충격을 줄 때 가장 영향력이 강합니다.
And there's been some really wonderful surveys carried out recently by Ipsos MORI in the last few years. They did a survey of over 1,000 adults in the UK, and said, for every 100 people in England and Wales, how many of them are Muslim? Now the average answer from this survey, which was supposed to be representative of the total population, was 24. That's what people thought. British people think 24 out of every 100 people in the country are Muslim. Now, official figures reveal that figure to be about five. So there's this big variation between what we think, our perception, and the reality as given by statistics. And I think that's interesting. What could possibly be causing that misperception?
그리고 최근 주목할만한 설문 조사가 있었습니다. Ipsos MORI가 몇년 간 실행한 조사입니다. 그들은 영국 성인 1,000명에게 물었습니다. 잉글랜드와 웨일즈 사람 100명 중 무슬림은 몇 명이나 될까요? 그 결과 전체 인구를 나타내는 평균대답은 24였습니다. 사람들 생각으론 그랬던 거죠. 영국 사람 100명 중 무슬림은 24명일 거라고요. 공식 수치에 따르면 5명입니다. 우리가 느끼고 생각하는 것과 통계 사이에 간극이 있는 것입니다. 아주 흥미롭게도 말이죠. 무엇이 이런 오인을 만드는 걸까요?
And I was so thrilled with this study, I started to take questions out in presentations. I was referring to it. Now, I did a presentation at St. Paul's School for Girls in Hammersmith, and I had an audience rather like this, except it was comprised entirely of sixth-form girls. And I said, "Girls, how many teenage girls do you think the British public think get pregnant every year?" And the girls were apoplectic when I said the British public think that 15 out of every 100 teenage girls get pregnant in the year. And they had every right to be angry, because in fact, I'd have to have closer to 200 dots before I could color one in, in terms of what the official figures tell us.
저는 이 연구로 인해 흥분해 강연 때마다 질문을 던지기 시작했습니다. 한번은 해머스미스에 있는 세인트폴 여학교에 가서 강연을 했습니다. 지금처럼 많은 사람 앞이었는데 전부 6학년 여자아이들이었습니다. 제가 말했죠. "여러분, 영국사회가 영국에서 얼마나 많은 십대 여학생들이 임신을 한다 생각한다고 생각해요? 여학생들은 제가 영국사회가 100명의 십대 청소년들 중 15명이 임신을 한다 생각한다고 말했을 때 분노했습니다. 그리고 그들은 화낼 권리가 충분히 있었어요. 왜냐면 공식적인 통계에 의하면 실제로는 한개의 점을 색칠하려면 200개에 가까운 점들이 있어야 하거든요.
And rather like numeracy, this is not just an English problem. Ipsos MORI expanded the survey in recent years to go across the world. And so, they asked Saudi Arabians, for every 100 adults in your country, how many of them are overweight or obese? And the average answer from the Saudis was just over a quarter. That's what they thought. Just over a quarter of adults are overweight or obese. The official figures show, actually, it's nearer to three-quarters.
그리고 이것은 계산능력처럼 영국만의 문제가 아닙니다. Ipsos MORI는 최근 이 설문조사를 온 세계로 확장했습니다. 그리고 사우디 아라비아 사람들에게 물었죠. 나라 안의 성인 100명 당 몇 명이 비만이라고 생각하세요? 그리고 평균적인 대답은 4분의 1을 조금 넘었습니다. 그들은 그렇게 생각하고 있었죠. 4분의 1보다 조금 많은 사람들이 비만이라고요. 그렇지만 공식적인 통계학은 사실 4분의 3이라고 나타내고 있습니다.
(Laughter)
(웃음)
So again, a big variation.
다시, 엄청나게 큰 차이죠.
And I love this one: they asked in Japan, they asked the Japanese, for every 100 Japanese people, how many of them live in rural areas? The average was about a 50-50 split, just over halfway. They thought 56 out of every 100 Japanese people lived in rural areas. The official figure is seven.
그리고 이건 정말 재밌는데: 그들은 일본에서 일본인들에게 물었습니다. 일본인들 100명 중 몇 명이 시골에 산다고 생각해요? 평균 대답은 약 50대 50으로 나뉘었습니다. 반 정도로요. 그들은 일본인들 100명 중 56명이 시골에서 산다고 생각하고 있었어요. 공식적인 통계는 7명입니다.
So extraordinary variations, and surprising to some, but not surprising to people who have read the work of Daniel Kahneman, for example, the Nobel-winning economist. He and his colleague, Amos Tversky, spent years researching this disjoint between what people perceive and the reality, the fact that people are actually pretty poor intuitive statisticians. And there are many reasons for this. Individual experiences, certainly, can influence our perceptions, but so, too, can things like the media reporting things by exception, rather than what's normal. Kahneman had a nice way of referring to that. He said, "We can be blind to the obvious" -- so we've got the numbers wrong -- "but we can be blind to our blindness about it." And that has enormous repercussions for decision making.
엄청난 차이입니다. 몇몇 사람들에게는 놀랍지만 예를 들어 노벨상 수상자인 경제학자 다니엘 카네만의 저작물을 이미 읽었던 사람들에게는 놀랍지 않을 겁니다. 그와 그의 동료 아모스 트버스키는 수년 동안 사람들이 인지하는 것과 실제의 차이를 연구했습니다. 사람들은 직관적인 통계에 약하다는 것을요. 그리고 여기에는 많은 이유가 있습니다. 개인의 경험은 당연히 자신의 인식을 바꿀 수 있고 몇몇 것들만 발표하는 대중매체들도 영향력을 끼칠 수 있습니다. 카네만은 그것을 이렇게 칭했습니다. "우리는 당연한 것을 보지 못할 수 있다." 우리는 숫자를 맞추지 못했죠. "하지만 우리는 우리의 맹목을 보지 못할 수 있다." 그리고 그것은 뭔가를 결정할 때 영향을 끼칠 수 있습니다.
So at the statistics office while this was all going on, I thought this was really interesting. I said, this is clearly a global problem, but maybe geography is the issue here. These were questions that were all about, how well do you know your country? So in this case, it's how well do you know 64 million people? Not very well, it turns out. I can't do that. So I had an idea, which was to think about this same sort of approach but to think about it in a very local sense. Is this a local? If we reframe the questions and say, how well do you know your local area, would your answers be any more accurate?
그래서 이런 조사들이 이루어지고 있을 때 통계학 연구소에서 저는 이것들이 매우 흥미롭다고 생각했습니다. 저는 이것이 분명한 세계적인 문제라고 말했고 지리가 문제일 수도 있다고 말했습니다. 모든 질문들은 사람들이 자신의 나라를 얼마나 잘 아는가에 대한 것들이었습니다. 그러면 6천 4백명의 사람들에 대해서는 얼마나 알까요? 결과에 의하면 잘 모르죠. 그래서 저는 한 발상이 있었습니다. 같은 식으로 접근하되, 지역적으로만 생각하는 겁니다. 이게 지역적인 질문일까요? 질문을 고쳐서 여러분의 지역에 대해 잘 아냐고 그렇게 묻는다면 대답이 더 정확해 질까요?
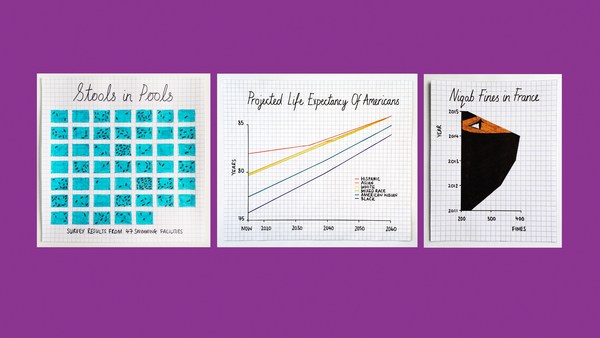
So I devised a quiz: How well do you know your area? It's a simple Web app. You put in a post code and then it will ask you questions based on census data for your local area. And I was very conscious in designing this. I wanted to make it open to the widest possible range of people, not just the 49 percent who can get the numbers. I wanted everyone to engage with it. So for the design of the quiz, I was inspired by the isotypes of Otto Neurath from the 1920s and '30s. Now, these are methods for representing numbers using repeating icons. And the numbers are there, but they sit in the background. So it's a great way of representing quantity without resorting to using terms like "percentage," "fractions" and "ratios."
그래서 저는 퀴즈를 하나 만들었습니다. 당신의 지역에 대해 얼마나 잘 아나요? 매우 간단한 인터넷 앱이었죠. 우편번호를 입력하고 그 지역의 인구 조사를 바탕으로 만들어진 질문들을 묻습니다. 그리고 저는 이걸 만들 때 최대한 큰 범위의 사람들에게 열려있게 하려 했습니다. 계산능력을 갖고있는 49% 뿐만이 아니라 모든 사람들이 참여하기를 바랬습니다. 그래서 이 퀴즈를 디자인할 때, 1920년도와 1930년도의 오토 느라트의 동위 원소에 의해 영감을 받았습니다. 이것들은 반복되는 아이콘을 이용한 숫자를 나타내는 방법입니다. 그리고 숫자들은 배경에만 존재하는 겁니다. '"퍼센트," "분수" 그리고 "비율" 같은 용어들을 쓰지 않고 양을 나타내는 좋은 방법이죠.
So here's the quiz. The layout of the quiz is, you have your repeating icons on the left-hand side there, and a map showing you the area we're asking you questions about on the right-hand side. There are seven questions. Each question, there's a possible answer between zero and a hundred, and at the end of the quiz, you get an overall score between zero and a hundred. And so because this is TEDxExeter, I thought we would have a quick look at the quiz for the first few questions of Exeter. And so the first question is: For every 100 people, how many are aged under 16? Now, I don't know Exeter very well at all, so I had a guess at this, but it gives you an idea of how this quiz works. You drag the slider to highlight your icons, and then just click "Submit" to answer, and we animate away the difference between your answer and reality. And it turns out, I was a pretty terrible guess: five.
그리고 이게 퀴즈입니다. 퀴즈의 배치는 왼 쪽에 반복되는 아이콘들이 있고 우리가 묻는 질문들의 지역을 보여주는 지도가 오른쪽에 있습니다. 7개의 질문들이 있습니다. 각각의 질문들은 0에서 100중에 답을 고를 수 있습니다. 그리고 퀴즈의 마지막에는 0에서 100중의 최종 점수를 받습니다. 여기가 TEDxExeter이니까 Exeter에관한 문제들 몇가지를 볼까 합니다. 첫 번째 문제는 100명중 몇명이 16세 이하일까요? 저는 Exeter에 대해 잘 모릅니다. 그래서 저는 추측을 했어요. 그치만 이 퀴즈가 어떻게 작동하는지는 보여주죠. 슬라이더를 움직여서 아이콘을 색칠하고 "제출하기"를 눌러 답을 제출합니다. 그리고 당신의 답과 현실을 구분시켜주죠. 그리고 5명이라고 했던 제 추측은 완전히 틀렸습니다.
How about the next question? This is asking about what the average age is, so the age at which half the population are younger and half the population are older. And I thought 35 -- that sounds middle-aged to me.
다음 문제는 어떨까요? 이 문제는 평균 나이에 대해 묻습니다. 인구의 반이 나이가 많고 나머지 반이 나이가 적을 때 평균 나이를 말입니다. 그리고 저는 35살이라고 생각했습니다- 저한테는 꽤 중간 같이 들렸거든요.
(Laughter)
(웃음)
Actually, in Exeter, it's incredibly young, and I had underestimated the impact of the university in this area. The questions get harder as you go through. So this one's now asking about homeownership: For every 100 households, how many are owned with a mortgage or loan? And I hedged my bets here, because I didn't want to be more than 50 out on the answer.
실제로 Exeter의 평균나이는 엄청 어립니다. 그리고 저는 이 지역 대학들의 영향을 과소평가했죠. 질문들은 거칠수록 더 어려워집니다. 이번에는 자택소유에 관해 묻고있네요. 100개의 가정들 중에 몇개가 대출을 통해 집을 소유할까요? 그리고 저는 답을 얼버무렸어요. 왜냐면 진짜 답과 50이상 차이나기 싫었거든요.
(Laughter)
(웃음)
And actually, these get harder, these questions, because when you're in an area, when you're in a community, things like age -- there are clues to whether a population is old or young. Just by looking around the area, you can see it. Something like homeownership is much more difficult to see, so we revert to our own heuristics, our own biases about how many people we think own their own homes.
그리고 실제로 이 질문들은 더욱 어려워집니다. 왜냐면 지역사회에 속해있을 때 나이같은 것들은 인구 나이가 어린지 어리지 않은지 힌트들이 있거든요. 그저 주변을 둘러보는 것만으로도 볼 수 있습니다. 자택소유 같은 것들은 알기 더 어렵죠. 그래서 우리는 우리만의 발견법을 다시 사용합니다. 얼마나 많은 사람들이 자택을 소유하는지에 대한 우리의 편견말이죠.
Now the truth is, when we published this quiz, the census data that it's based on was already a few years old. We've had online applications that allow you to put in a post code and get statistics back for years. So in some senses, this was all a little bit old and not necessarily new. But I was interested to see what reaction we might get by gamifying the data in the way that we have, by using animation and playing on the fact that people have their own preconceptions.
사실 저희가 이 퀴즈를 공개했을 때 이미 몇년이 지난 인구 조사를 사용했었습니다. 우편번호를 넣는 온라인 앱을 통해서 통계를 받았습니다. 그러니까 가장 최근 것은 아니지만 많이 오래되진 않은 것이었습니다. 하지만 저는 이것을 애니메이션과 사람들이 각자의 선입견을 갖고있다는 사실을 이용해 정보를 게임화 시킨다면 어떤 반응을 일으킬지 궁금했습니다.
It turns out, the reaction was, um ... was more than I could have hoped for. It was a long-held ambition of mine to bring down a statistics website due to public demand.
그 반응은 음... 제가 바라던 것보다 엄청났습니다. 저는 오랫동안 대중들의 요구로 인해 통계 사이트를 폐지하는 것을 야망으로 품어왔습니다.
(Laughter)
(웃음)
This URL contains the words "statistics," "gov" and "UK," which are three of people's least favorite words in a URL. And the amazing thing about this was that the website came down at quarter to 10 at night, because people were actually engaging with this data of their own free will, using their own personal time. I was very interested to see that we got something like a quarter of a million people playing the quiz within the space of 48 hours of launching it. And it sparked an enormous discussion online, on social media, which was largely dominated by people having fun with their misconceptions, which is something that I couldn't have hoped for any better, in some respects. I also liked the fact that people started sending it to politicians. How well do you know the area you claim to represent?
이 웹주소는 "통계," "정부" 그리고 "영국"이라는 단어들, 즉 웹주소에 쓰이는 단어들 중 사람들이 싫어하는 세 개의 단어들이 포함되어 있습니다. 그리고 이것이 놀라운 것은 이 웹사이트가 밤 10시가 되기 15분 전에 폐지되었다는 것입니다. 사람들이 자신들의 시간을 써가면서 이 자료들에 관심을 쏟는 선택을 했기 때문이죠. 저는 퀴즈를 공개한지 48시간 만에 약 25만 명 정도의 사람들이 사용하는 것을 보고 매우 흥미로워 했습니다. 그리고 온라인 상과 소셜 미디어 상에서 자신들의 오인을 통해 재미를 보는 사람들이 대다수였던 큰 논쟁을 일으켰습니다. 제가 더 바랄 것이 없던 상황이라고도 할 수 있었습니다. 어떻게 보면요. 저는 그리고 사람들이 이것을 정치인들에게 보내기 시작했다는 것이 좋았습니다. 자신들이 대표하는 지역에 대해 얼마나 많이 알고 있을까요?
(Laughter)
(웃음)
And then just to finish, going back to the two kinds of people, I thought it would be really interesting to see how people who are good with numbers would do on this quiz. The national statistician of England and Wales, John Pullinger, you would expect he would be pretty good. He got 44 for his own area.
그리고 마지막으로 두 가지의 사람들에 관한 얘기로 돌아가자면 저는 숫자에 능통한 사람들이 이 퀴즈에서 얼마나 잘 할 수 있는지 궁금했습니다. 영국과 웨일스의 국가 통계학자인 존 풀링거는 엄청 잘 볼거라고 예상하겠지만 자신의 지역에 44점을 맞았습니다.
(Laughter)
(웃음)
Jeremy Paxman -- admittedly, after a glass of wine -- 36. Even worse. It just shows you that the numbers can inspire us all. They can surprise us all.
제레미 팍스맨은-사실 와인 한 잔을 하고난 뒤였지만- 36점을 받았습니다. 더 나쁜 점수죠. 이 것은 숫자가 우리를 격려할 수 있다는 것을 보여줍니다. 우리를 놀라게 할 수 있습니다.
So very often, we talk about statistics as being the science of uncertainty. My parting thought for today is: actually, statistics is the science of us. And that's why we should be fascinated by numbers.
우리는 통계에 대해 불확실의 과학이라고 이야기합니다. 저는 이렇게 생각합니다. 통계는 우리에 대한 과학이라고. 그리고 이것은 우리가 숫자에 매료되어야 하는 이유입니다.
Thank you very much.
감사합니다.
(Applause)
(박수)