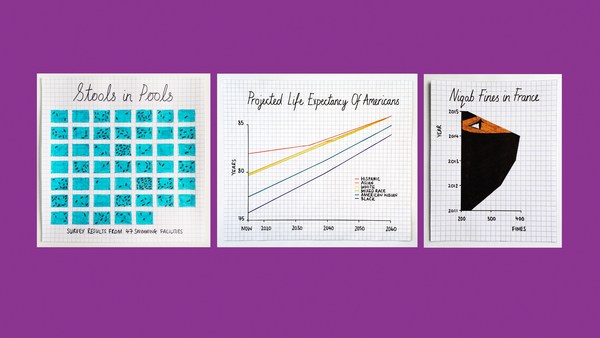
Back in 2003, the UK government carried out a survey. And it was a survey that measured levels of numeracy in the population. And they were shocked to find out that for every 100 working age adults in the country, 47 of them lacked Level 1 numeracy skills. Now, Level 1 numeracy skills -- that's low-end GCSE score. It's the ability to deal with fractions, percentages and decimals. So this figure prompted a lot of hand-wringing in Whitehall. Policies were changed, investments were made, and then they ran the survey again in 2011. So can you guess what happened to this number? It went up to 49.
Nel 2003 Il governo britannico ha fatto un sondaggio. Era un sondaggio per misurare la capacità di calcolo della popolazione. Sono rimasti scioccati nello scoprire che nel Paese, su 100 adulti in età da lavoro 47 non avevano capacità di calcolo di Livello 1. Il livello 1 è il più basso del biennio della scuola secondaria. È la capacità di usare frazioni, percentuali e decimali. Questo dato ha preoccupato molto i governanti. Le politiche sono state cambiate, si sono fatti investimenti, e hanno rifatto il sondaggio nel 2011. Indovinate cosa è successo al quel risultato? È salito a 49.
(Laughter)
(Risate)
And in fact, when I reported this figure in the FT, one of our readers joked and said, "This figure is only shocking to 51 percent of the population."
Quanto ho pubblicato il dato nel Finacial Times, uno dei lettori scherzando ha detto: "Questo dato è scioccante solo per il 51% della popolazione".
(Laughter)
(Risate)
But I preferred, actually, the reaction of a schoolchild when I presented at a school this information, who raised their hand and said, "How do we know that the person who made that number isn't one of the 49 percent either?"
In realtà ho preferito la reazione di un alunno che, mentre presentavo questi dati in una scuola, ha alzato la mano e ha detto: "Come sappiamo che chi che ha elaborato quel numero non fa parte del 49%?"
(Laughter)
(Risate)
So clearly, there's a numeracy issue, because these are important skills for life, and a lot of the changes that we want to introduce in this century involve us becoming more comfortable with numbers.
Quindi è chiaro che c'è un problema di abilità di calcolo perché sono abilità importanti nella vita, e molti dei cambiamenti che vogliamo attuare in questo secolo implicano che si sia più a proprio agio con i numeri.
Now, it's not just an English problem. OECD this year released some figures looking at numeracy in young people, and leading the way, the USA -- nearly 40 percent of young people in the US have low numeracy. Now, England is there too, but there are seven OECD countries with figures above 20 percent. That is a problem, because it doesn't have to be that way. If you look at the far end of this graph, you can see the Netherlands and Korea are in single figures. So there's definitely a numeracy problem that we want to address.
Non è solo un problema britannico. Quest'anno l'OECD ha pubblicato dei dati sull'abilità di calcolo dei giovani e in testa ci sono gli USA -- quasi il 40% di giovani negli USA ha scarse abilità di calcolo. C'è anche l'Inghilterra, ma ci sono sette paesi OECD con un dato superiore al 20%. Questo è un problema, perché non deve essere così. Se osservate l'estremità del grafico, vedrete che l'Olanda e la Corea hanno un numero a una sola cifra. Quindi c'è una chiara mancanza di abilità con i numeri che vogliamo segnalare.
Now, as useful as studies like these are, I think we risk herding people inadvertently into one of two categories; that there are two kinds of people: those people that are comfortable with numbers, that can do numbers, and the people who can't. And what I'm trying to talk about here today is to say that I believe that is a false dichotomy. It's not an immutable pairing. I think you don't have to have tremendously high levels of numeracy to be inspired by numbers, and that should be the starting point to the journey ahead.
Per quanto questi studi siano utili, rischiamo di spingere inavvertitamente le persone in una delle due categorie; ci sono due tipi di persone: quelle brave con i numeri, che sanno fare i calcoli e quelle non ci riescono. Ciò che voglio provare a dire qui oggi è che secondo me questa è una falsa dicotomia. Non è una abbinamento immutabile. Credo che non serva avere abilità eccezionali con i numeri per esserne affascinati. Questo dovrebbe essere il punto di partenza del percorso da seguire.
And one of the ways in which we can begin that journey, for me, is looking at statistics. Now, I am the first to acknowledge that statistics has got somewhat of an image problem.
Uno dei modi migliori per iniziare, secondo me, è analizzare le statistiche. Sono il primo a dire che le statistiche hanno una sorta di problema di immagine.
(Laughter)
(Risate)
It's the part of mathematics that even mathematicians don't particularly like, because whereas the rest of maths is all about precision and certainty, statistics is almost the reverse of that. But actually, I was a late convert to the world of statistics myself. If you'd asked my undergraduate professors what two subjects would I be least likely to excel in after university, they'd have told you statistics and computer programming, and yet here I am, about to show you some statistical graphics that I programmed.
È quella parte della matematica che persino i matematici non amano molto, perché mentre il resto della matematica è fatto di precisione e certezze, la statistica invece è quasi l'opposto. Io stesso mi sono convertito in ritardo al mondo della statistica. Se aveste chiesto a miei professori in quali due materie probabilmente non avrei brillato dopo l'università, vi avrebbero detto statistica e programmazione di computer. Eppure eccomi qui a mostrarvi dei grafici di statistica programmati da me.
So what inspired that change in me? What made me think that statistics was actually an interesting thing? It's really because statistics are about us. If you look at the etymology of the word statistics, it's the science of dealing with data about the state or the community that we live in. So statistics are about us as a group, not us as individuals. And I think as social animals, we share this fascination about how we as individuals relate to our groups, to our peers. And statistics in this way are at their most powerful when they surprise us.
Cosa ha ispirato il mio cambiamento? Cosa mi ha fatto pensare che la statistica fosse interessante? È perché la statistica parla di noi. L'etimologia della parola statistica indica la scienza di elaborare dati sul paese o sulla comunità in cui viviamo. Perciò la statistica parla di noi come gruppo, non noi come individui. Penso che come animali sociali, siamo affascinati da come noi come individui ci relazioniamo col gruppo, con i nostri pari. La statistica raggiunge il suo massimo quando ci sorprende.
And there's been some really wonderful surveys carried out recently by Ipsos MORI in the last few years. They did a survey of over 1,000 adults in the UK, and said, for every 100 people in England and Wales, how many of them are Muslim? Now the average answer from this survey, which was supposed to be representative of the total population, was 24. That's what people thought. British people think 24 out of every 100 people in the country are Muslim. Now, official figures reveal that figure to be about five. So there's this big variation between what we think, our perception, and the reality as given by statistics. And I think that's interesting. What could possibly be causing that misperception?
Di recente sono stati fatti sondaggi meravigliosi da Ipsos MORI negli ultimi anni. Hanno intervistato 1.000 adulti nel Regno Unito chiedendo: "Su 100 persone in Inghilterra e nel Galles, quanti di loro sono musulmani?" La risposta media a questa domanda, che doveva rappresentare il totale della popolazione, è stata 24. Quello era il pensiero della gente. I britannici pensano che nel loro paese 24 persone su 100 sono musulmane. Ora, dati ufficiali dicono che sono circa 5. Quindi c'è un grosso divario tra ciò che crediamo, la nostra percezione, e la realtà data dalla statistica. Penso sia interessante. Quale potrebbe essere la causa di questa errata percezione?
And I was so thrilled with this study, I started to take questions out in presentations. I was referring to it. Now, I did a presentation at St. Paul's School for Girls in Hammersmith, and I had an audience rather like this, except it was comprised entirely of sixth-form girls. And I said, "Girls, how many teenage girls do you think the British public think get pregnant every year?" And the girls were apoplectic when I said the British public think that 15 out of every 100 teenage girls get pregnant in the year. And they had every right to be angry, because in fact, I'd have to have closer to 200 dots before I could color one in, in terms of what the official figures tell us.
Ero così elettrizzato da questo studio, che ho iniziato ad accettare domande durante le mie presentazioni sul tema. In una presentazione alla scuola femminile di Saint Paul a Hammersmith avevo un pubblico più o meno come questo, solo che era di ragazze tra i 16 e i 18 anni. Dissi: "Ragazze, secondo voi, per i britannici quante adolescenti restano incinte ogni anno?" Le ragazze si infuriarono quando dissi che i britannici pensano che 15 adolescenti su 100 restino incinte ogni anno. Avevano tutte le ragioni per essere arrabbiate, perché in effetti bisogna arrivare quasi a 200 pallini per aggiungerne uno colorato e mostrare il dato ufficiale.
And rather like numeracy, this is not just an English problem. Ipsos MORI expanded the survey in recent years to go across the world. And so, they asked Saudi Arabians, for every 100 adults in your country, how many of them are overweight or obese? And the average answer from the Saudis was just over a quarter. That's what they thought. Just over a quarter of adults are overweight or obese. The official figures show, actually, it's nearer to three-quarters.
Proprio come l'abilità di calcolo, questo non è un problema solo inglese. Ipsos MORI negli ultimi anni ha esteso la ricerca a tutto il mondo. In Arabia Saudita hanno chiesto su 100 persone adulte nel Paese quante di loro sono in sovrappeso o obesi? La risposta media dei cittadini è stata "poco più di un quarto". Credevano che solo un quarto della popolazione fosse sovrappeso o obesa. I dati ufficiali però mostrano che sono quasi tre quarti.
(Laughter)
(Risate)
So again, a big variation.
Quindi, di nuovo, un grande divario.
And I love this one: they asked in Japan, they asked the Japanese, for every 100 Japanese people, how many of them live in rural areas? The average was about a 50-50 split, just over halfway. They thought 56 out of every 100 Japanese people lived in rural areas. The official figure is seven.
Questa mi piace: hanno chiesto in Giappone, quanti giapponesi su 100 vivono in aree rurali? La media era quasi al 50%, poco più della metà Pensavano che 56 giapponesi su 100 vivessero in campagna. Secondo i dati ufficiali sono 7.
So extraordinary variations, and surprising to some, but not surprising to people who have read the work of Daniel Kahneman, for example, the Nobel-winning economist. He and his colleague, Amos Tversky, spent years researching this disjoint between what people perceive and the reality, the fact that people are actually pretty poor intuitive statisticians. And there are many reasons for this. Individual experiences, certainly, can influence our perceptions, but so, too, can things like the media reporting things by exception, rather than what's normal. Kahneman had a nice way of referring to that. He said, "We can be blind to the obvious" -- so we've got the numbers wrong -- "but we can be blind to our blindness about it." And that has enormous repercussions for decision making.
Queste incredibili variazioni sorprenderanno alcuni, ma non chi ha letto il lavoro di Danoel Kahneman, ad esempio, premio nobel per l'economia. Insieme al collega Amos Tversky, ha passato anni a studiare la discrepanza tra la percezione della gente e la realtà, il fatto che le persone hanno un pessimo intuito statistico. E le ragioni sono molte. È certo che le esperienze individuali influenzano le nostre percezioni, ma anche i meda lo fanno, riportando i casi eccezionali e non ciò che è normale. Kahneman aveva un bel modo di spiegarlo: "Possiamo essere ciechi davanti all'evidenza (e avere numeri sbagliati) ma possiamo essere ciechi di fronte alla nostra cecità". Questo ha ripercussioni enormi sulle decisioni.
So at the statistics office while this was all going on, I thought this was really interesting. I said, this is clearly a global problem, but maybe geography is the issue here. These were questions that were all about, how well do you know your country? So in this case, it's how well do you know 64 million people? Not very well, it turns out. I can't do that. So I had an idea, which was to think about this same sort of approach but to think about it in a very local sense. Is this a local? If we reframe the questions and say, how well do you know your local area, would your answers be any more accurate?
Mentre tutto questo accadeva all'ufficio di statistica, ho pensato che fosse davvero interessante, che di certo era un problema globale, ma forse la questione era legata alla geografia. Erano tutte domande sulla conoscenza del proprio paese. Quindi, nel nostro caso è quanto conosci 64 milioni di persone. Non bene, visto l'esito. Non potevo procedere così. Ma ho avuto un'idea, che era utilizzare lo stesso approccio ma pensarlo in senso molto più locale. Questo è locale? Se riformuliamo le domande e chiediamo quanto conoscete la vostra zona, le risposte saranno più precise?
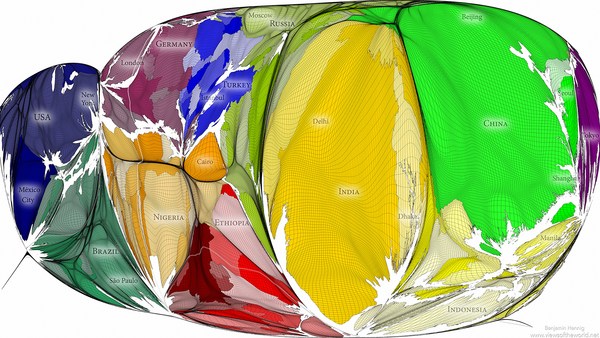
So I devised a quiz: How well do you know your area? It's a simple Web app. You put in a post code and then it will ask you questions based on census data for your local area. And I was very conscious in designing this. I wanted to make it open to the widest possible range of people, not just the 49 percent who can get the numbers. I wanted everyone to engage with it. So for the design of the quiz, I was inspired by the isotypes of Otto Neurath from the 1920s and '30s. Now, these are methods for representing numbers using repeating icons. And the numbers are there, but they sit in the background. So it's a great way of representing quantity without resorting to using terms like "percentage," "fractions" and "ratios."
Così ho ideato un quiz: "Quanto conosci la tua zona?" È una semplice App per il web. Si inserisce il codice postale e vengono fatte domande che si basano sui dati censuari della propria zona. Ho elaborato il quiz con molta attenzione. Volevo che raggiungesse un pubblico più ampio possibile, non solo al 49% che sa capire i numeri. Volevo che tutti fossero coinvolti. Per realizzare il quiz, mi sono ispirato agli Isotye di Otto Neurath degli anni '20 e '30. È un metodo di rappresentare i numeri usando figure ripetute. I numeri sono lì, ma restano sullo sfondo. È un ottimo modo di rappresentare una quantità senza ricorrere a parole come "percentuale" "frazione" o "proporzione".
So here's the quiz. The layout of the quiz is, you have your repeating icons on the left-hand side there, and a map showing you the area we're asking you questions about on the right-hand side. There are seven questions. Each question, there's a possible answer between zero and a hundred, and at the end of the quiz, you get an overall score between zero and a hundred. And so because this is TEDxExeter, I thought we would have a quick look at the quiz for the first few questions of Exeter. And so the first question is: For every 100 people, how many are aged under 16? Now, I don't know Exeter very well at all, so I had a guess at this, but it gives you an idea of how this quiz works. You drag the slider to highlight your icons, and then just click "Submit" to answer, and we animate away the difference between your answer and reality. And it turns out, I was a pretty terrible guess: five.
Questo è il quiz. La sua struttura è così, sulla sinistra ci sono le icone ripetute, e una mappa mostra la zona selezionata per le domande sulla destra. Ci sono sette domande. A ogni domanda si può dare una risposta tra 0 a 100 e alla fine del quiz si ottiene un punteggio totale tra 0 e 100. E visto che siamo a TEDxExeter, ho pensato di mostrarvi brevemente il quiz con qualche domanda su Exeter. La prima domanda è: su 100 persone, quante sono minori di 16 anni? Non conoscendo bene Exeter, ho tirato a indovinare, ma questo vi dà un'idea di come funziona il quiz. Trascinate il cursore per evidenziare le icone, poi cliccate "Invio" per confermare la risposta, poi noi animiamo la differenza tra la vostra risposta e la realtà. e si scopre che la mia idea era proprio sbagliata: cinque.
How about the next question? This is asking about what the average age is, so the age at which half the population are younger and half the population are older. And I thought 35 -- that sounds middle-aged to me.
E prossima domanda? Ci chiede qual è l'età media, cioè l'età in cui metà della popolazione è più giovane e l'altra metà è più vecchia. Io ho pensato 35, mi suonava come mezz'età.
(Laughter)
(Risate)
Actually, in Exeter, it's incredibly young, and I had underestimated the impact of the university in this area. The questions get harder as you go through. So this one's now asking about homeownership: For every 100 households, how many are owned with a mortgage or loan? And I hedged my bets here, because I didn't want to be more than 50 out on the answer.
In realtà Exeter è incredibilmente giovane, avevo sottovalutato l'impatto dell'università in questa zona. Le domande sono più difficili andando avanti. Questa riguarda le case di proprietà: su 100 case, quante sono di proprietà o con mutuo? Qui non mi sono sbilanciato perché non volevo sforare di 50 con la risposta.
(Laughter)
(Risate)
And actually, these get harder, these questions, because when you're in an area, when you're in a community, things like age -- there are clues to whether a population is old or young. Just by looking around the area, you can see it. Something like homeownership is much more difficult to see, so we revert to our own heuristics, our own biases about how many people we think own their own homes.
Le domande diventano sempre più difficili perché se state in una zona, se siete parte di una comunità, cose come l'età -- si può vedere se la gente è vecchia o giovane. Se vi guardate intorno, si può vedere. Per cose come le case di proprietà è molto più difficile da vedere, quindi ci affidiamo al nostro intuito alla nostra idea di quante persone possiedano una casa.
Now the truth is, when we published this quiz, the census data that it's based on was already a few years old. We've had online applications that allow you to put in a post code and get statistics back for years. So in some senses, this was all a little bit old and not necessarily new. But I was interested to see what reaction we might get by gamifying the data in the way that we have, by using animation and playing on the fact that people have their own preconceptions.
La verità è che quando abbiamo pubblicato il quiz, i dati del censimento sui cui si basava, erano già vecchi di qualche anno. Per anni abbiamo raccolto adesioni online attraverso il codice postale per poi elaborarne una statistica. In un certo senso, il quiz era un po' vecchio e non necessariamente aggiornato. Ma ero interessato alla reazione che potevamo suscitare rendendo i dati come un gioco usando l'animazione e giocando sul fatto che la gente ha dei preconcetti.
It turns out, the reaction was, um ... was more than I could have hoped for. It was a long-held ambition of mine to bring down a statistics website due to public demand.
Alla fine, la reazione è stata ... più di quanto avrei potuto sperare. È sempre stata una mia ambizione far saltare un sito web di statistica per troppi accessi.
(Laughter)
(Risate)
This URL contains the words "statistics," "gov" and "UK," which are three of people's least favorite words in a URL. And the amazing thing about this was that the website came down at quarter to 10 at night, because people were actually engaging with this data of their own free will, using their own personal time. I was very interested to see that we got something like a quarter of a million people playing the quiz within the space of 48 hours of launching it. And it sparked an enormous discussion online, on social media, which was largely dominated by people having fun with their misconceptions, which is something that I couldn't have hoped for any better, in some respects. I also liked the fact that people started sending it to politicians. How well do you know the area you claim to represent?
Questa URL contiene le parole "statistica", "gov" e "UK" che sono le parole meno preferite dalla gente in una URL. La cosa più sconvolgente è che il sito è saltato alle dieci meno un quarto di sera, perché le persone si erano dedicate al quiz di loro spontanea volontà, usando il loro tempo libero. Sono stato molto colpito nel vedere che qualcosa come un quarto di milione di persone ha partecipato al quiz dopo solo 48 ore dal lancio. Poi è partita un'enorme discussione online, sui social media, dominata principalmente dalle persone divertite dalle proprie convinzioni sbagliate e non avrei potuto sperare di meglio, in un certo senso. Mi è piaciuto anche il fatto che abbiano iniziato a spedirlo ai politici. Quanto conosci la zona che dici di rappresentare?
(Laughter)
(Risate)
And then just to finish, going back to the two kinds of people, I thought it would be really interesting to see how people who are good with numbers would do on this quiz. The national statistician of England and Wales, John Pullinger, you would expect he would be pretty good. He got 44 for his own area.
E per concludere, tornando ai due tipi di persone, ho pensato che fosse interessante vedere come se la cavavano col quiz le persone brave coi numeri Lo statistico di Inghilterra e Galles, John Pullinger, pensereste che sia andato bene. Ha raggiunto 44 sulla sua zona.
(Laughter)
(Risate)
Jeremy Paxman -- admittedly, after a glass of wine -- 36. Even worse. It just shows you that the numbers can inspire us all. They can surprise us all.
Jeremy Paxman - dopo un bicchiere di vino, l'ha ammesso - 36 Anche peggio. Questo dimostra che i numeri possono ispirare tutti noi. Possono sorprenderci tutti.
So very often, we talk about statistics as being the science of uncertainty. My parting thought for today is: actually, statistics is the science of us. And that's why we should be fascinated by numbers.
Molto spesso parliamo di statistica come la scienza dell'incertezza. Vi lascio con questa considerazione: in realtà la statistica è la scienza del "noi". È il motivo per cui dovremmo essere affascinati dai numeri.
Thank you very much.
Grazie
(Applause)
(Applausi)