Back in 2003, the UK government carried out a survey. And it was a survey that measured levels of numeracy in the population. And they were shocked to find out that for every 100 working age adults in the country, 47 of them lacked Level 1 numeracy skills. Now, Level 1 numeracy skills -- that's low-end GCSE score. It's the ability to deal with fractions, percentages and decimals. So this figure prompted a lot of hand-wringing in Whitehall. Policies were changed, investments were made, and then they ran the survey again in 2011. So can you guess what happened to this number? It went up to 49.
ב-2003, ממשלת אנגליה ערכה סקר. וזה היה סקר שמדד את רמת יכולות החשיבה המתמטית באוכלוסייה. והם נדהמו לגלות שעל כל 100 אנשים בגיל העבודה במדינה, ל47 מהם חסרו יכולות מתמטיות ברמה 1. עכשיו, יכולות מתמטיות ברמה 1 -- זה הטווח התחתון בציוני מבחני הבגרות. זה היכולת להתמודד עם שברים, אחוזים ומספרים עשרוניים. אז המספר הזה גרם להרבה לחץ בבית הנבחרים. מדיניות השתנתה, השקעות נעשו, ואז הם הריצו את הסקר שוב ב-2011. אתם יכולים לנחש מה קרה למספר הזה? הוא עלה ל 49.
(Laughter)
(צחוק)
And in fact, when I reported this figure in the FT, one of our readers joked and said, "This figure is only shocking to 51 percent of the population."
ולמעשה, כשדיווחתי את המספר הזה ב-FT (מגזין פיננסי), אחד הקוראים שלנו התבדח ואמר, "המספר הזה הוא מזעזע רק ל-51 אחוז מהאוכלוסיה."
(Laughter)
(צחוק)
But I preferred, actually, the reaction of a schoolchild when I presented at a school this information, who raised their hand and said, "How do we know that the person who made that number isn't one of the 49 percent either?"
אבל אני מעדיף, למעשה, את התגובה של התלמיד כשהצגתי את המידע הזה בבית הספר, שהרים את ידו ואמר, "איך אתם יודעים שהאדם שיצר את המספר הזה הוא לא גם אחד מה-49 אחוזים?"
(Laughter)
(צחוק)
So clearly, there's a numeracy issue, because these are important skills for life, and a lot of the changes that we want to introduce in this century involve us becoming more comfortable with numbers.
אז בברור, יש בעיות ביכולות החשיבה המתמטית, בגלל שאלה כישורים חשובים לחיים, והרבה מהשינויים האלה שאנחנו רוצים להציג במאה הזו כוללים לגרום לנו להרגיש יותר בנוח עם מספרים.
Now, it's not just an English problem. OECD this year released some figures looking at numeracy in young people, and leading the way, the USA -- nearly 40 percent of young people in the US have low numeracy. Now, England is there too, but there are seven OECD countries with figures above 20 percent. That is a problem, because it doesn't have to be that way. If you look at the far end of this graph, you can see the Netherlands and Korea are in single figures. So there's definitely a numeracy problem that we want to address.
עכשיו, זה לא רק בעיה באנגליה. ה-OECD השנה שחרר כמה מספרים שבודקים יכולות חשיבה מתמטית באנשים צעירים, ומובילה את הדרך, ארצות הברית -- כמעט ל 40 אחוז מהאנשים הצעירים בארצות הברית יש יכולת חשיבה מתמטית נמוכה. עכשיו, אנגליה גם שם, אבל יש שבע מדינות ב-OECD עם מספרים גבוהים מ-20 אחוז. זו בעיה, בגלל שזה לא חייב להיות כך. אם אתם מביטים בצד הרחוק של הגרף, אתם יכולים לראות את הולנד וקוריאה מחזיקות בספרות בודדות. אז יש בהחלט בעיה ביכולת החשיבה המתמטית שבה אנחנו רוצים לטפל.
Now, as useful as studies like these are, I think we risk herding people inadvertently into one of two categories; that there are two kinds of people: those people that are comfortable with numbers, that can do numbers, and the people who can't. And what I'm trying to talk about here today is to say that I believe that is a false dichotomy. It's not an immutable pairing. I think you don't have to have tremendously high levels of numeracy to be inspired by numbers, and that should be the starting point to the journey ahead.
עכשיו, כמה שלימודים כאלה חשובים, אני חושב שאנחנו מסתכנים בלרעות אנשים לא בכוונה לאחת הקטגוריות האלו; שיש שני סוגי אנשים: האנשים שנוח להם עם מספרים, שיכולים לעשות חשבון, והאנשים שלא. ומה שאני מנסה לדבר עליו פה היום זה שאני מאמין שזו דיכוטומיה שיקרית. זה לא שילוב בלתי ניתן לשינוי. אני חושב שלא צריכות להיות לכם יכולות יוצאות דופן בחשיבה מתמטית כדי לקבל השראה ממספרים, וזו צריכה להיות נקודת הפתיחה למסע שלנו קדימה.
And one of the ways in which we can begin that journey, for me, is looking at statistics. Now, I am the first to acknowledge that statistics has got somewhat of an image problem.
ואחת הדרכים בהן אנחנו יכולים להתחיל את המסע הזה, בשבילי, זה להביט בסטטיסטיקות. עכשיו, אני הראשון להכיר בעובדה שלסטטיסטיקה יש קצת תדמית בעייתית.
(Laughter)
(צחוק)
It's the part of mathematics that even mathematicians don't particularly like, because whereas the rest of maths is all about precision and certainty, statistics is almost the reverse of that. But actually, I was a late convert to the world of statistics myself. If you'd asked my undergraduate professors what two subjects would I be least likely to excel in after university, they'd have told you statistics and computer programming, and yet here I am, about to show you some statistical graphics that I programmed.
זה החלק במתמטיקה שאפילו מתמטיקאים לא ממש אוהבים, בגלל שבעוד ששאר המתמטיקה נוגעת כולה לדיוק וודאות, סטטיסטיקה היא כמעט ההפך מזה. אבל למעשה, הומרתי מאוחר לעולם הסטטיסטיקה בעצמי. אם הייתם שואלים את הפרופסורים שלי לתואר שני איזה שני נושאים הכי פחות סביר שאצטיין בהם אחרי האוניברסיטה, הם היו אמרים לכם סטטיסטיקה ותכנות, ועדיין הנה אני, עומד להראות לכם כמה גרפים סטטיסטיים שתכנתתי.
So what inspired that change in me? What made me think that statistics was actually an interesting thing? It's really because statistics are about us. If you look at the etymology of the word statistics, it's the science of dealing with data about the state or the community that we live in. So statistics are about us as a group, not us as individuals. And I think as social animals, we share this fascination about how we as individuals relate to our groups, to our peers. And statistics in this way are at their most powerful when they surprise us.
אז מה נתן השראה לשינוי הזה בי? מה גרם לי לחשוב שסטטיסטיקה היתה למעשה משהו מעניין? זה באמת בגלל שסטטיסטיקה נוגעת לנו. אם אתם מביטים באטימולוגיה של המילה סטטיסטיקה, זה המדע של להתמודד עם מידע שנוגע למדינה או לקהילה בה אנחנו חיים. אז סטטיסטיקות נוגעות לנו כקבוצה, לא לנו כאנשים בודדים. ואני חושב שכחיות חברותיות, אנחנו חולקים את הקסם הזה שנוגע לאיך אנחנו כאנשים מתייחסים לקבוצות שלנו, לעמיתים שלנו. וסטטיסטיקה בדרך זו היא הכי חזקה כשהיא מפתיעה אותנו.
And there's been some really wonderful surveys carried out recently by Ipsos MORI in the last few years. They did a survey of over 1,000 adults in the UK, and said, for every 100 people in England and Wales, how many of them are Muslim? Now the average answer from this survey, which was supposed to be representative of the total population, was 24. That's what people thought. British people think 24 out of every 100 people in the country are Muslim. Now, official figures reveal that figure to be about five. So there's this big variation between what we think, our perception, and the reality as given by statistics. And I think that's interesting. What could possibly be causing that misperception?
והיו סקרים באמת נפלאים שנערכו לאחרונה על ידי איפסוס מורי בשנים האחרונות. הם עשו סקר של יותר מ 1,000 בוגרים באנגליה, ואמרו, עבור כל 100 אנשים באנגליה וווילס, כמה מהם מוסלמים? עכשיו התשובה הממוצעת לסקר הזה, שהיו אמורים להיות מייצגים את כל האוכלוסיה היתה, 24. זה מה שאנשים חשבו. אנשים בריטים חשבו ש 24 מתוך כל 100 אנשים במדינה הם מוסלמים. עכשיו, מספרים רשמיים גילו שהמספר האמיתי הוא בערך חמישה. אז יש את הגיוון הגדול הזה בין מה שאנחנו חושבים, התפישה שלנו, והמציאות כמו שניתנה על ידי סטטיסטיקה. ואני חושב שזה מעניין. מה יכול לגרום לתפישות המוטעות האלו?
And I was so thrilled with this study, I started to take questions out in presentations. I was referring to it. Now, I did a presentation at St. Paul's School for Girls in Hammersmith, and I had an audience rather like this, except it was comprised entirely of sixth-form girls. And I said, "Girls, how many teenage girls do you think the British public think get pregnant every year?" And the girls were apoplectic when I said the British public think that 15 out of every 100 teenage girls get pregnant in the year. And they had every right to be angry, because in fact, I'd have to have closer to 200 dots before I could color one in, in terms of what the official figures tell us.
והתרגשתי כל כך מהמחקר הזה, שהתחלתי לשאול שאלות במצגות, התייחסתי לזה. עכשיו, עשיתי מצגת בבית הספר סיינט פול לבנות בהאמרסמית', והיה לי קהל די דומה לזה, חוץ מזה שהוא היה מורכב לגמרי מבנות בכיתה ו'. ואמרתי, "בנות, כמה בנות עשרה אתן חושבות שהציבור הבריטי חושב שנכנסות להריון כל שנה?" והבנות היו סמוקות פנים כשאמרתי הציבור הבריטי חושב ש 15 מתוך כל 100 נערות נכנסות להריון כל שנה. והיתה להן כל זכות להתרגז, בגלל שלמעשה, היו צריכות להיות לי יותר קרוב ל 200 נקודות לפני שאני אוכל לצבוע אחת, במונחים של מה שהמספרים האמיתיים אומרים לנו.
And rather like numeracy, this is not just an English problem. Ipsos MORI expanded the survey in recent years to go across the world. And so, they asked Saudi Arabians, for every 100 adults in your country, how many of them are overweight or obese? And the average answer from the Saudis was just over a quarter. That's what they thought. Just over a quarter of adults are overweight or obese. The official figures show, actually, it's nearer to three-quarters.
ובדומה ליכולת חשיבה מתמטית, זו לא רק בעיה בריטית. איפסוס מורי הרחיבו את הסקר בשנים האחרונות לכל רחבי העולם. וכך, הם שאלו סעודים, לכל 100 בוגרים במדינה שלכם, כמה מהם במשקל יתר או עבי בשר? והתשובה הממוצעת מהסעודים היתה יותר מרבע. זה מה שהם חשבו. קצת יותר מרבע מהמבוגרים במשקל עודף או עבי בשר. המספרים הרשמיים מראים, למעשה, שזה קרוב יותר לשלושה רבעים.
(Laughter)
(צחוק)
So again, a big variation.
אז שוב, הבדל גדול.
And I love this one: they asked in Japan, they asked the Japanese, for every 100 Japanese people, how many of them live in rural areas? The average was about a 50-50 split, just over halfway. They thought 56 out of every 100 Japanese people lived in rural areas. The official figure is seven.
ואני אוהב את זה: הם שאלו ביפן, הם שאלו את היפנים, עבור כל 100 יפנים, כמה מהם חיים באיזורים כפריים? הממוצע היה בערך חלוקה של 50-50, קצת מעל החצי. הם חשבו ש 56 מתוך כל 100 יפנים חיים באזורים כפריים. המספר הרשמי הוא שבעה.
So extraordinary variations, and surprising to some, but not surprising to people who have read the work of Daniel Kahneman, for example, the Nobel-winning economist. He and his colleague, Amos Tversky, spent years researching this disjoint between what people perceive and the reality, the fact that people are actually pretty poor intuitive statisticians. And there are many reasons for this. Individual experiences, certainly, can influence our perceptions, but so, too, can things like the media reporting things by exception, rather than what's normal. Kahneman had a nice way of referring to that. He said, "We can be blind to the obvious" -- so we've got the numbers wrong -- "but we can be blind to our blindness about it." And that has enormous repercussions for decision making.
אז הבדלים יוצאי דופן ומפתיעים לכמה, אבל לא מפתיעים לאנשים שקראו את העבודה של דניאל כהנמן, לדוגמה, כלכלן זוכה נובל. הוא ועמיתו, עמוס טברסקי, בילו שנים בחקר הנתק הזה בין מה שאנשים קולטים והמציאות, העובדה שלאנשים למעשה יש אינטואיציה גרועה לסטטיסטיקה. ויש הרבה סיבות לזה. חוויות אישיות, בהחלט, יכולות להשפיע על התפיסה שלנו, אבל כך, גם דברים כמו המדיה שמדווחת על דברים כיוצאי דופן, במקום מה שנורמלי. לכהנמן היתה דרך יפה להתייחס לזה, הוא אמר - "אנחנו יכולים להיות עיוורים לברור מאליו, זה אומר שיש לנו מספרים לא נכונים, "אבל אנחנו יכולים להיות עוורים גם לעוורון שלנו בנוגע לזה." ויש לזה השלכות עצומות לקבלת החלטות.
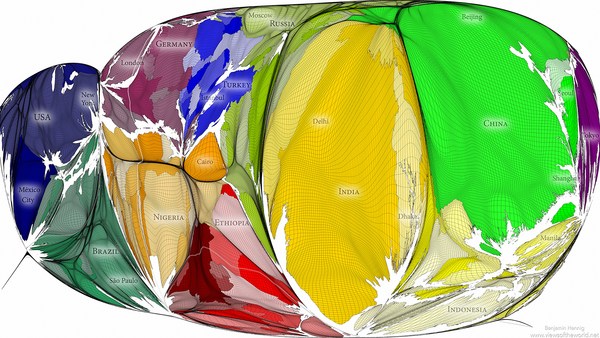
So at the statistics office while this was all going on, I thought this was really interesting. I said, this is clearly a global problem, but maybe geography is the issue here. These were questions that were all about, how well do you know your country? So in this case, it's how well do you know 64 million people? Not very well, it turns out. I can't do that. So I had an idea, which was to think about this same sort of approach but to think about it in a very local sense. Is this a local? If we reframe the questions and say, how well do you know your local area, would your answers be any more accurate?
אז במשרד הסטטיסטיקות בזמן שזה התרחש, חשבתי שזה באמת מעניין. אמרתי, זו בהחלט בעיה גלובלית, אבל אולי גאוגרפיה היא העניין פה. אלה היו שאלות שנגעו לכמה טוב אתם מכירים את המדינה שלכם? אז במקרה הזה, זה כמה טוב אתם מכירים 64 מליון אנשים? לא ממש טוב, מסתבר. אני לא יכול לעשות את זה. אז היה לי רעיון, שהיה לחשוב על סוג זה של גישה אבל לחשוב על זה במובן מאוד מקומי. האם זה מקומי? אם נמסגר מחדש את השאלה ונגיד, כמה טוב אתם מכירים את האזור המקומי שלכם, האם התשובה שלכם תהיה יותר מדוייקת?
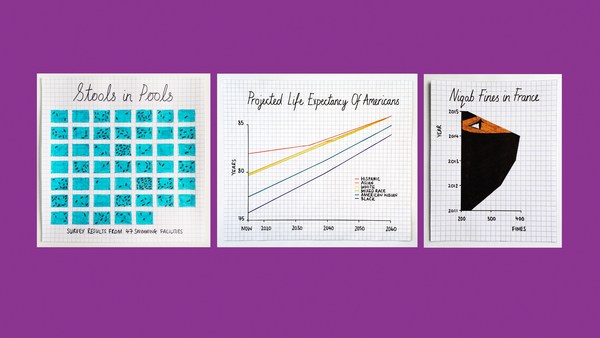
So I devised a quiz: How well do you know your area? It's a simple Web app. You put in a post code and then it will ask you questions based on census data for your local area. And I was very conscious in designing this. I wanted to make it open to the widest possible range of people, not just the 49 percent who can get the numbers. I wanted everyone to engage with it. So for the design of the quiz, I was inspired by the isotypes of Otto Neurath from the 1920s and '30s. Now, these are methods for representing numbers using repeating icons. And the numbers are there, but they sit in the background. So it's a great way of representing quantity without resorting to using terms like "percentage," "fractions" and "ratios."
אז חיברתי שאלון: כמה טוב אתם מכירים את האזור שלכם? זו אפליקציה אינטרנטית פשוטה. אתם מכניסים את המיקוד ואז זה ישאל אתכם שאלות שמבוססות על מידע מפקד אוכלוסין לאזור המקומי שלכם. והייתי מאוד מודע בעיצוב של זה. רציתי לעשות אותה פתוחה למגוון האנשים הרחב ביותר, לא רק 49 אחוז שיכולים לחשב. רציתי שכולם ישתתפו בזה. אז לעיצוב החידון, קיבלתי השראה ממערכת הסמלים של אוטו נוירת' משנות ה 20 וה30 של המאה ה 20. עכשיו, אלה שיטות לייצוג מספרים בשימוש בסמלילים חוזרים. והמספרים שם, אבל הם יושבים ברקע. אז זו דרך מעולה ליצג כמות בלי להשתמש במונחים כמו "אחוזים," "שברים" ו"יחסים."
So here's the quiz. The layout of the quiz is, you have your repeating icons on the left-hand side there, and a map showing you the area we're asking you questions about on the right-hand side. There are seven questions. Each question, there's a possible answer between zero and a hundred, and at the end of the quiz, you get an overall score between zero and a hundred. And so because this is TEDxExeter, I thought we would have a quick look at the quiz for the first few questions of Exeter. And so the first question is: For every 100 people, how many are aged under 16? Now, I don't know Exeter very well at all, so I had a guess at this, but it gives you an idea of how this quiz works. You drag the slider to highlight your icons, and then just click "Submit" to answer, and we animate away the difference between your answer and reality. And it turns out, I was a pretty terrible guess: five.
אז הנה השאלון. הסידור של השאלון הוא, יש לכם סמלילים חוזרים מצד שמאל שם, ומפה שמראה לכם את האזור עליו אנחנו שואלים אתכם שאלות מצד ימין. יש שבע שאלות. לכל שאלה, יש תשובה אפשרית בין אפס למאה, ובסוף השאלון, מקבלים תוצאה כללית בין אפס למאה. וכך בגלל שזה TEDx אקסטר, חשבתי שתהיה לנו הצצה מהירה על החידון בכמה מהשאלות הראשונות על אקסטר. וכך השאלה הראשונה היא: עבור כל 100 אנשים, כמה מתחת לגיל 16? עכשיו, אני לא מכיר את אקסטר טוב בכלל, אז היה לי ניחוש בקשר לזה, אבל זה נותן לכם רעיון על איך החידון הזה עובד. אתם גוררים את הסרגל להאיר את הסמלילים שלכם, ואז פשוט תלחצו "שליחה" כדי לענות, ואנחנו מנפישים את ההבדל בין התשובה שלכם והמציאות. ומסתבר, הייתי די גרוע בניחוש: חמש.
How about the next question? This is asking about what the average age is, so the age at which half the population are younger and half the population are older. And I thought 35 -- that sounds middle-aged to me.
מה עם השאלה הבאה? היא שואלת בנוגע למה הגיל הממוצע, אז הגיל בו חצי מהאוכלוסיה צעירה יותר וחצי מהאוכלוסיה מבוגרת יותר. וחשבתי 35 -- זה נשמע גיל ממוצע בשבילי.
(Laughter)
(צחוק)
Actually, in Exeter, it's incredibly young, and I had underestimated the impact of the university in this area. The questions get harder as you go through. So this one's now asking about homeownership: For every 100 households, how many are owned with a mortgage or loan? And I hedged my bets here, because I didn't want to be more than 50 out on the answer.
למעשה, באקסטר, זה ממש צעיר, והערכתי נמוך מדי את ההשפעה של האוניברסיטה באיזור הזה. השאלה נעשית קשה יותר כשאתם ממשיכים. אז זו שואלת בנוגע לבעלות על בתים: עבור כל 100 בתים, כמה מהם בבעלות עם משכנתה או הלוואה? וגידרתי את ההימור שלי פה, בגלל שלא רציתי להיות בסטייה של יותר מ 50 בתשובה.
(Laughter)
(צחוק)
And actually, these get harder, these questions, because when you're in an area, when you're in a community, things like age -- there are clues to whether a population is old or young. Just by looking around the area, you can see it. Something like homeownership is much more difficult to see, so we revert to our own heuristics, our own biases about how many people we think own their own homes.
ולמעשה, אלה נעשים קשים יותר, השאלות האלו, בגלל שכשאתם באיזור, כשאתם בקהילה, דברים כמו גיל -- יש רמזים לאם האוכלוסיה מבוגרת או צעירה. רק בלהביט סביב האיזור, אתם יכולים לראות את זה. משהו כמו בעלות על בתים היא הרבה יותר קשה לראות, אז אנחנו חוזרים להיוריסטיקה שלנו, הדעות הקדומות שלנו בנוגע לכמה אנשים אנחנו חושבים שהם בעלי הבתים שלהם.
Now the truth is, when we published this quiz, the census data that it's based on was already a few years old. We've had online applications that allow you to put in a post code and get statistics back for years. So in some senses, this was all a little bit old and not necessarily new. But I was interested to see what reaction we might get by gamifying the data in the way that we have, by using animation and playing on the fact that people have their own preconceptions.
עכשיו האמת, כשאנחנו מפרסמים את החידון הזה, מידע הצנזוס שהוא מבוסס עליו כבר היה בן כמה שנים. היו לנו כניסות ברשת שמאפשרות לכם להכניס את המיקוד ולקבל סטטיסטיקות שנים אחורה. אז בכמה מובנים, זה היה הכל מעט ישן ולא בהכרח חדש. אבל התעניינתי לראות איזו תגובה נקבל בלהפוך את המידע למשחק בדרך בה עשינו, על ידי שימוש באנימציה ולשחק על העובדה שלאנשים יש תפישות משלהם.
It turns out, the reaction was, um ... was more than I could have hoped for. It was a long-held ambition of mine to bring down a statistics website due to public demand.
מסתבר, שהתגובה היתה, אממ... היתה יותר משהייתי יכול לצפות. זו היתה שאיפה ישנה שלי להפיל אתר סטטיסטיקה בגלל דרישת הקהל,
(Laughter)
(צחוק)
This URL contains the words "statistics," "gov" and "UK," which are three of people's least favorite words in a URL. And the amazing thing about this was that the website came down at quarter to 10 at night, because people were actually engaging with this data of their own free will, using their own personal time. I was very interested to see that we got something like a quarter of a million people playing the quiz within the space of 48 hours of launching it. And it sparked an enormous discussion online, on social media, which was largely dominated by people having fun with their misconceptions, which is something that I couldn't have hoped for any better, in some respects. I also liked the fact that people started sending it to politicians. How well do you know the area you claim to represent?
ה URL הזה מכיל את המילים "סטטיסטיקה," "ממשלה" ו"UK," שהן שלוש מהמילים הכי פחות אהודות ב-URL. והדבר המדהים בנוגע לזה היה שהאתר ירד ברבע ל 10 בערב, בגלל שאנשים למעשה התחברו למידע מרצונם החופשי, בשימוש בזמן האישי שלהם. מאוד התענייתי לראות שקיבלנו משהו כמו רבע מליון אנשים שמשחקים בחידון תוך 48 שעות מעלייתו. והוא הצית דיון עצום ברשת, במדיה החברתית, שנשלט בעיקר של ידי אנשים שנהנים מהתפישות המוטעות שלהם, שזה משהו שלא יכולתי לקוות לטוב ממנו, בכמה מובנים. אהבתי גם את העובדה שאנשים התחילו לשלוח אותו לפוליטיקאים. כמה טוב אתם מכירים את האיזור שאתם טוענים שאתם מייצגים?
(Laughter)
(צחוק)
And then just to finish, going back to the two kinds of people, I thought it would be really interesting to see how people who are good with numbers would do on this quiz. The national statistician of England and Wales, John Pullinger, you would expect he would be pretty good. He got 44 for his own area.
ואז רק כדי לסיים, אם נחזור לשני סוגי האנשים, חשבתי שזה יהיה מאוד מעניין לראות איך אנשים שטובים במספרים יצליחו בחידון. הסטטיסטיקאי הלאומי של אנגליה וווילס, ג'ון פולינגר, הייתם מצפים שהוא יהיה די טוב. הוא קיבל 44 לאיזור שלו.
(Laughter)
(צחוק)
Jeremy Paxman -- admittedly, after a glass of wine -- 36. Even worse. It just shows you that the numbers can inspire us all. They can surprise us all.
ג'רמי פקסמן -- אם אני אודה, אחרי כוס יין -- 36. אפילו גרוע מזה. זה רק מראה לכם שהמספרים יכולים לתת השראה לכולנו. הם יכולים להפתיע את כולנו.
So very often, we talk about statistics as being the science of uncertainty. My parting thought for today is: actually, statistics is the science of us. And that's why we should be fascinated by numbers.
אז הרבה פעמים, אנחנו מדברים על סטטיסטיקה כמדע של חוסר הביטחון. מחשבת הפרידה שלי להיום היא: למעשה, סטטיסטיקה היא המדע שלנו. ולכן אנחנו צריכים להיות מוקסמים מהמספרים.
Thank you very much.
תודה רבה לכם.
(Applause)
(מחיאות כפיים)