Back in 2003, the UK government carried out a survey. And it was a survey that measured levels of numeracy in the population. And they were shocked to find out that for every 100 working age adults in the country, 47 of them lacked Level 1 numeracy skills. Now, Level 1 numeracy skills -- that's low-end GCSE score. It's the ability to deal with fractions, percentages and decimals. So this figure prompted a lot of hand-wringing in Whitehall. Policies were changed, investments were made, and then they ran the survey again in 2011. So can you guess what happened to this number? It went up to 49.
در سال ۲۰۰۳، دولت انگلستان تحقیقی را انجام داد این تحقیق درباره مهارت های حساب کردن در نزد مردم بود. آنها از آنچه فهمیدند شوکه شدند اینکه از هر ۱۰۰ نفر در سن کار در کشور ۴۷ نفر از آنان فاقد مهارتهای اولیهی حساب بودند. کنون، مهارتهای اولیه حساب، نمرهی حداقلی برای (آزمون) GSCE است. و این (مهارت اولیه) یعنی توانایی فهم کارکرد کسرها، درصدها و اعداد اعشاری. بنابراین، این رقم نگرانی بسیاری از افراد را در وایت هال(مقر حکومت و ادارات مختلف دولتی انگلستان) برانگیخت. سیاستها تغییر کردند، سرمایهگذاریها انجام گرفت، و سپس در سال ۲۰۱۱ تحقیق دیگری را ترتیب دادند. میدانید چه اتفاقی برای این رقم افتاد؟ تا ۴۹ بالا رفت.
(Laughter)
(خنده)
And in fact, when I reported this figure in the FT, one of our readers joked and said, "This figure is only shocking to 51 percent of the population."
و در حقیقت وقتی من این رقم را در نشریه فایننشال تایمز گزارش دادم ، یکی از خوانندگان به شوخی گفت، "این ارقام فقط برای ۵۱ درصد از مردم تعجبآور است."
(Laughter)
(خنده)
But I preferred, actually, the reaction of a schoolchild when I presented at a school this information, who raised their hand and said, "How do we know that the person who made that number isn't one of the 49 percent either?"
اما من واکنش یک کودک مدرسه ای را بیشتر پسندیدم زمانی که این اطلاعات را در یک مدرسه ارائه دادم، دستش را بالا برد و گفت، "چطور میتوانیم بفهمیم،کسی که این عدد را محاسبه کرده است، یکی از آن ۴۹ درصد (فاقد مهارت حساب) نیست؟"
(Laughter)
(خنده)
So clearly, there's a numeracy issue, because these are important skills for life, and a lot of the changes that we want to introduce in this century involve us becoming more comfortable with numbers.
بدون شک مسئله حساب وجود دارد، چون مهارت مهمی برای زندگی است، و بسیاری ازتغییراتی که قرار است در این قرن انجام دهیم مستلزم این است که ما در کار کردن با عدد و رقم وضعمان خوب باشد.
Now, it's not just an English problem. OECD this year released some figures looking at numeracy in young people, and leading the way, the USA -- nearly 40 percent of young people in the US have low numeracy. Now, England is there too, but there are seven OECD countries with figures above 20 percent. That is a problem, because it doesn't have to be that way. If you look at the far end of this graph, you can see the Netherlands and Korea are in single figures. So there's definitely a numeracy problem that we want to address.
خب، این فقط مشکل (مردم) انگلستان نیست. سازمان همکاری و توسعه اقتصادیOECD در سال جاری آماری را درباره وضع حساب در جوانان ارائه داد، و معلوم شد در ایالات متحده آمریکا حدود ۴۰ درصد از جوانان حسابشان بد است. شرایط انگلستان هم در همین حدود است، اما هفت کشور عضو OECD ، آمار بالای ۲۰ درصد دارند. مشکل همینجاست. چون قاعدتاً نباید اینطوری باشد. اگر به انتهای این نمودار نگاه کنید، می بینید که آمار مربوط به هلند و کره(جنوبی) تک رقمی است. پس قطعا مسئله خراب بودن حساب وجود دارد که باید به آن رسیدگی شود.
Now, as useful as studies like these are, I think we risk herding people inadvertently into one of two categories; that there are two kinds of people: those people that are comfortable with numbers, that can do numbers, and the people who can't. And what I'm trying to talk about here today is to say that I believe that is a false dichotomy. It's not an immutable pairing. I think you don't have to have tremendously high levels of numeracy to be inspired by numbers, and that should be the starting point to the journey ahead.
حالا، با این مطالعات مفیدی که اینجا است، فکر میکنم ما با طبقه بندی تصادفی مردم در دو گروه ریسک می کنیم؛ دو گروه از افراد داریم: آنهایی که در کار با اعداد راحتاند، و حساب را بلد هستند، و کسانی که نمیتوانند. امروز اینجا هستم تا بگویم که معتقدم این تقسیمبندی اشتباه است. این تغییرناپذیری نیستند. فکر میکنم، شما نیازی به داشتن دانش فوقالعادهایی از حساب کتاب ندارید تا به وسیله اعداد مورد الهام قرار بگیرید. این میتواند نقطهی شروعی برای سفر پیشرو باشد.
And one of the ways in which we can begin that journey, for me, is looking at statistics. Now, I am the first to acknowledge that statistics has got somewhat of an image problem.
یکی از راههایی که ما میتوانیم سفر را شروع کنیم، برای من، نگاه کردن به آمار است. حالا، من اولین کسی هستم که اذعان میکنم آمار تاحدی از مشکل تصویری میآید.
(Laughter)
(خنده)
It's the part of mathematics that even mathematicians don't particularly like, because whereas the rest of maths is all about precision and certainty, statistics is almost the reverse of that. But actually, I was a late convert to the world of statistics myself. If you'd asked my undergraduate professors what two subjects would I be least likely to excel in after university, they'd have told you statistics and computer programming, and yet here I am, about to show you some statistical graphics that I programmed.
این قسمتی از ریاضیات است. که حتی خود ریاضیدانان آن را به خصوص دوست ندارند، زیرا در حالیکه مابقی ریاضیات تماماً در مورد دقت و قطعیت است، آمار تقریباً برعکس آن است. اما در عمل،من یک تازه وارد در دنیای آماربودم. وقتی شما از استادان دوره لیسانسم بپرسید بعد از دوران دانشگاه من در کدام درسها کمترین برتری را خواهم داشت، به شما خواهند گفت آمار و برنامهنویسی کامپیوتر، و الان من اینجا هستم، تا چند آمار گرافیکی را به شما نشان بدهم که آنها را برنامهنویسی کردهام.
So what inspired that change in me? What made me think that statistics was actually an interesting thing? It's really because statistics are about us. If you look at the etymology of the word statistics, it's the science of dealing with data about the state or the community that we live in. So statistics are about us as a group, not us as individuals. And I think as social animals, we share this fascination about how we as individuals relate to our groups, to our peers. And statistics in this way are at their most powerful when they surprise us.
چه عاملی باعث آن تغییر در من شد؟ چه چیزی مرا بدان داشت که فکر کنم آمار واقعا موضوع جالبی است؟ دلیل واقعیاش این است که آمار در مورد ما است. اگر شما به ریشهی (انگلیسی) کلمه آمار نگاه کنید، علم برخورد با دادههاست در مورد وضعیت و جامعهایی که ما در آن زندگی میکنیم. پس آمار در مورد ما بهعنوان یک گروه است، نه مه بهعنوان افراد. و من فکر میکنم ما به عنوان حیوانات اجتماعی، همگی دارای این مشخصه جالب هستیم که چطور به عنوان یک فرد به گروه هایمان یا به همتایانمان مرتبطیم. و آماراز این نظر، در قدرتمندترین حالت خود هستند وقتی که مارا شگفت زده میکنند.
And there's been some really wonderful surveys carried out recently by Ipsos MORI in the last few years. They did a survey of over 1,000 adults in the UK, and said, for every 100 people in England and Wales, how many of them are Muslim? Now the average answer from this survey, which was supposed to be representative of the total population, was 24. That's what people thought. British people think 24 out of every 100 people in the country are Muslim. Now, official figures reveal that figure to be about five. So there's this big variation between what we think, our perception, and the reality as given by statistics. And I think that's interesting. What could possibly be causing that misperception?
و اخیراً نظرسنجی واقعا شگفت انگیزی صورت گرفته که توسط (شرکت) ایپسوس موری در چند سال اخیر جمع اوری شده است. آنها یک نظرسنجی در بین بیش از ۱۰۰۰ بزرگسال در انگلستان انجام دادند، که می گفت، برای هر ۱۰۰ نفر در انگلیس و ولز، چند نفرشان مسلمان هستند؟ میانگین پاسخ این نظرسنجی، که بفرض نماینده کل جمعیت هستند، ۲۴ نفر بود، آنچیزی بود که مردم فکر میکردند. مردم انگلستان گمان می کنند که از هر ۱۰۰ نفر در این کشور، ۲۴ نفر مسلمان هستند. حال آن که گزارش های رسمی حاکی است که این رقم حدود پنج است. پس یک اختلاف بزرگ است مابین آنچه که ما فکر میکنیم، و برداشت ما، و واقعیتی که آمار می گوید. و من فکر میکنم این جالب است. چه چیزی میتواند دلیل این کژپنداری باشد؟
And I was so thrilled with this study, I started to take questions out in presentations. I was referring to it. Now, I did a presentation at St. Paul's School for Girls in Hammersmith, and I had an audience rather like this, except it was comprised entirely of sixth-form girls. And I said, "Girls, how many teenage girls do you think the British public think get pregnant every year?" And the girls were apoplectic when I said the British public think that 15 out of every 100 teenage girls get pregnant in the year. And they had every right to be angry, because in fact, I'd have to have closer to 200 dots before I could color one in, in terms of what the official figures tell us.
من آنقدر تحت تاثیر این مطالعه قرار گرفتم، که در سخنرانی هایم شروع کردم به طرح سوال و به آن رجوع می کردم. یک سخنرانی داشتم در مدرسه دخترانه سنت پال در هامراسمیت، مخاطبانم چیزی شبیه اینجا بود، با این تفاوت که همگی دختران ممتاز دبیرستانی بودند. به آنها گفتم: «خانم ها، فکر میکنید، مردم بریتانیا تصور می کنند که چند نفر از دختران نوجوان هرساله باردار میشوند؟» آنان حیرت کردند وقتی که گفتم: افکار عمومی بریتانیا گمان می کند از هر ۱۰۰ دختر نوجوان ۱۵ نفر در هر سال باردار می شود. کاملا حق داشتند که عصبانی شوند، چراکه درحقیقت، من باید نزدیک به ۲۰۰ نقطه میداشتم تا بتوانم یکی از این توپ ها را رنگی کنم، (آمار رسمی حدود ۳۰ برابر کمتر است) با توجه آنچه که آمار رسمی میگویند.
And rather like numeracy, this is not just an English problem. Ipsos MORI expanded the survey in recent years to go across the world. And so, they asked Saudi Arabians, for every 100 adults in your country, how many of them are overweight or obese? And the average answer from the Saudis was just over a quarter. That's what they thought. Just over a quarter of adults are overweight or obese. The official figures show, actually, it's nearer to three-quarters.
و همانند آمار مربوط به تتوانایی حساب، این فقط مشکل مردم انگلستان نیست. شرکت آماری ایپسوس موری، این تحقیق را اخیرا در کل جهان انجام داد. از مردم عربستان پرسیدند، به ازای هر ۱۰۰ بزرگسال در کشورتان، چند نفر اضافه وزن دارند یا چاق اند؟ و پاسخ میانگین سعودیها این بود که فقط یک چهارم. این چیزی بود که آنها فکر میکردند. که فقط کمی بیش از یک چهارم بزرگسالان اضافه وزن دارند یا چاق اند. آمارهای رسمی نشان میدهد، در حقیقت، این رقم نزدیک به سه چهارم است.
(Laughter)
(خنده)
So again, a big variation.
پس باز، یک اختلاف فاحش،
And I love this one: they asked in Japan, they asked the Japanese, for every 100 Japanese people, how many of them live in rural areas? The average was about a 50-50 split, just over halfway. They thought 56 out of every 100 Japanese people lived in rural areas. The official figure is seven.
و من این یکی رو دوست دارم، آنها از مردم ژاپن پرسیدند، به ازای هر ۱۰۰ ژاپنی، چند نفر در روستا زندگی میکنند؟ پاسخ میانگین حدود ۵۰-۵۰ بود، اندکی بیشتر از نصف. آنها فکر میکردند از هر ۱۰۰ ژاپنی ۵۶ نفر در روستا زندگی میکند. آمار رسمی هفت نفر است.
So extraordinary variations, and surprising to some, but not surprising to people who have read the work of Daniel Kahneman, for example, the Nobel-winning economist. He and his colleague, Amos Tversky, spent years researching this disjoint between what people perceive and the reality, the fact that people are actually pretty poor intuitive statisticians. And there are many reasons for this. Individual experiences, certainly, can influence our perceptions, but so, too, can things like the media reporting things by exception, rather than what's normal. Kahneman had a nice way of referring to that. He said, "We can be blind to the obvious" -- so we've got the numbers wrong -- "but we can be blind to our blindness about it." And that has enormous repercussions for decision making.
این هم یک اختلاف غیرعادی و تعجب آور برای بعضی ها، اما تعجب آور نیست برای کسانی که آثار دنیل کانمن، اقتصاددان (و روانشناس) برنده جایزه نوبل، را خوانده اند. او و همکارش آموس تورسکی، سالها در مورد این عدم تطابق مابین آنچه مردم احساس میکنند و حقیقت، تحقیق کردند. واقعیت اینست که، مردم درک بسیار ضعیفی از آمار دارند. و دلایل بسیاری برای این مسئله وجود دارد. تجربه های شخصی ، قطعا میتواند بر روی برداشت افراد تاثیر بگذارد، و همچنین، چیزهایی مانند رسانهها که بیشتر موارد استثنا را گزارش می کنند، تا مسائل عادی را. کانمن برای توضیح مسئله روش خوبی داشت. او گفت، "چشم ما میتوانیم در مورد چیزهای آشکار کور باشد" پس ما اعداد اشتباهی دریافت میکنیم. "و در عین حال میتوانیم از کور بودن خود درباره آن مسئله نیز غافل باشیم." و آن می تواند پیامد عظیمی در تصمیم گیری ما داشته باشد.
So at the statistics office while this was all going on, I thought this was really interesting. I said, this is clearly a global problem, but maybe geography is the issue here. These were questions that were all about, how well do you know your country? So in this case, it's how well do you know 64 million people? Not very well, it turns out. I can't do that. So I had an idea, which was to think about this same sort of approach but to think about it in a very local sense. Is this a local? If we reframe the questions and say, how well do you know your local area, would your answers be any more accurate?
وقتی این (جریان) در اداره آمارگیری در حال وقوع بود، فکر کردم این واقعا جالب است. گفتم، این به وضوح یک مشکل جهانی است، اما شاید اینجا جغرافیا مسئله است. آن سوالها تماماً درمورد این بودند که چقدر شما کشورتان را میشناسید؟ پس در این مورد، مسئله این است که شما چقدر ۶۴ میلیون انسان را میشناسید؟ معلوم شد که شناخت خوبی ندارند. من این ایده را داشتم که می گفت همین رویکرد را داشته باشیم با این تفاوت که به همین مسئله به شکل محلی فکر کنیم. آیا این یک مسئله محلی است؟ اگر سوال را تغییر شکل دهیم و بگوییم، چقدر محله خودتان را میشناسید؟ آیا جواب شما دقیق تر خواهد بود؟
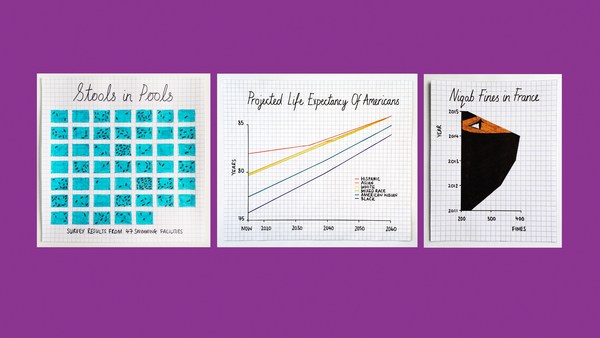
So I devised a quiz: How well do you know your area? It's a simple Web app. You put in a post code and then it will ask you questions based on census data for your local area. And I was very conscious in designing this. I wanted to make it open to the widest possible range of people, not just the 49 percent who can get the numbers. I wanted everyone to engage with it. So for the design of the quiz, I was inspired by the isotypes of Otto Neurath from the 1920s and '30s. Now, these are methods for representing numbers using repeating icons. And the numbers are there, but they sit in the background. So it's a great way of representing quantity without resorting to using terms like "percentage," "fractions" and "ratios."
پس من یک پرسشنامه طراحی کردم: چقدر شما محیط محلیتان را میشناسید؟ این یک اپلیکیشن ساده اینترنتی است. کد پستی تان را وارد میکنید و سپس سوالات سرشماری از شما پرسیده می شود، بر اساس محلتان. و من در طراحی این بسیار هوشیار بودم. میخواستم طوری باشد که تا جای ممکن برای طیف گسترده ای از مردم باز باشد، نه فقط ۴۹ درصدی از مردم که حساب بلدند. میخواستم همه با آن ارتباط برقرار کنند. بنابراین برای طراحی پرسشها، الهام گرفتم از تصاویر کشیده شده توسط اتو نویرات (جامعه شناس) از سال ۱۹۲۰ تا ۳۰ اینها روشهایی است برای نمایش اعداد که از شکلهای تکرارشونده استفاده کرده . اعداد هم در اینجا هستند، ولی در پس زمینه قرار گرفته اند. پس این روشی عالی برای نمایش کمیت است بدون نیاز به استفاده از مفاهیمی چون "درصد،" "کسر" و "نسبت ".
So here's the quiz. The layout of the quiz is, you have your repeating icons on the left-hand side there, and a map showing you the area we're asking you questions about on the right-hand side. There are seven questions. Each question, there's a possible answer between zero and a hundred, and at the end of the quiz, you get an overall score between zero and a hundred. And so because this is TEDxExeter, I thought we would have a quick look at the quiz for the first few questions of Exeter. And so the first question is: For every 100 people, how many are aged under 16? Now, I don't know Exeter very well at all, so I had a guess at this, but it gives you an idea of how this quiz works. You drag the slider to highlight your icons, and then just click "Submit" to answer, and we animate away the difference between your answer and reality. And it turns out, I was a pretty terrible guess: five.
این پرسشنامه است. طراح پرسشنامه اینطوری است، در سمت چپ شکل های تکرارشونده را دارید، و یک نقشه محدوده مورد پرسش را برایتان نشان میدهد در سمت راست. هفت سوال وجود دارد. برای هر سوال، پاسخی احتمالی بین صفر تا ۱۰۰ دارد، و در پایان پرسشنامه، شما از صفر تا ۱۰۰ نمره کلی می گیرید. و از آنجا که اینجا تداکس شهر اکستر است، فکر کردم نگاهی سریع به پرسشنامه بیاندازیم به چند سوال اول از شهر اکستر. اولین سوال این است: به ازای هر ۱۰۰ نفر، چند نفرشان زیر ۱۶ سال است؟ من به شهر اکستر چندان وارد نیستم، پس در این مورد حدس زدم، اما این به شما تصویری ارائه میده درباره نحوه کار پرسشنامه. شما برای روشن کردن آدمکها، اسلایدر را جابجا میکنید و بعد برای وارد کردن پاسخ روی "ثبت کردن" کلیک میکنید، و ما اختلاف میان پاسخ شما و واقعیت را با شکل نمایش میدهیم. و معلوم شد، حدس من چقدر خراب بوده. جواب : ۵
How about the next question? This is asking about what the average age is, so the age at which half the population are younger and half the population are older. And I thought 35 -- that sounds middle-aged to me.
برویم به سوال بعدی. این سوال درباره میانگین سنی است، سنی که در آن نصف جمعیت کمتر از آن و نصف جمعیت بیش از آن است. و از نظر من ۳۵ سن میانگین بود.
(Laughter)
(خنده)
Actually, in Exeter, it's incredibly young, and I had underestimated the impact of the university in this area. The questions get harder as you go through. So this one's now asking about homeownership: For every 100 households, how many are owned with a mortgage or loan? And I hedged my bets here, because I didn't want to be more than 50 out on the answer.
در واقع، جمعیت شهر اکستر، به طور غیرقابل باوری جوان است، من تاثیر دانشگاه در این منطقه را دست کم گرفتم. هرچه پیش می رویم پرسش ها سخت تر میشود. خب این یکی درباره مالکیت خانه است: از هر صد خانوار، چه تعداد با وام بانکی خریداری شده اند؟ و اینجا نمی خواهم بی گدار به آب بزنم، چون نمی خواستم بیش از ۵۰ درصد را جواب بدهم.
(Laughter)
(خنده)
And actually, these get harder, these questions, because when you're in an area, when you're in a community, things like age -- there are clues to whether a population is old or young. Just by looking around the area, you can see it. Something like homeownership is much more difficult to see, so we revert to our own heuristics, our own biases about how many people we think own their own homes.
و در واقع پرسش ها سخت تر می شوند، چون وقتی شما در یک ناحیه هستید، یا وقتی که در یک اجتماع هستید، در چیزهایی مثل سن، سرنخ هایی هست که کمک می کند بدانید جمعیت جوان است یا پیر. فقط با نگاه کردن به محیط اطراف، می توانید آن را دریابید. ولی بحثی مثل وضع مالکیت خانه چیزی نیست که قابل دیدن باشد، پس ما به اکتشافات خود بازمیگردیم، به پیشداوریهایمان درمورد اینکه به نظر ما چه تعداد از مردم مالک خانهشان هستند.
Now the truth is, when we published this quiz, the census data that it's based on was already a few years old. We've had online applications that allow you to put in a post code and get statistics back for years. So in some senses, this was all a little bit old and not necessarily new. But I was interested to see what reaction we might get by gamifying the data in the way that we have, by using animation and playing on the fact that people have their own preconceptions.
حقیقت این است که، وقتی ما این پرسشنامه را منتشر کردیم، اطلاعات آماری که پرسشنامه بر اساس آن بود، مربوط به چند سال پیش بود. ما برنامه آنلاینی داشتیم که اجازه میداد شما کدپستی خود را وارد کنید و آمار سالهای قبل را دریافت کنید. و در برخی موضوعات، این (داده ها) کمی قدیمی بود و لزوماً جدید نبود. اما من علاقمند بودم ببینم که مردم با دیدن بازی کردن ما با داده ها و تصویری کردن اطلاعات به وسیله انیمیشن و بازی کردن با این حقیقت که مردم دریافت های خودشان را دارند، چه واکنشی نشان می دهند.
It turns out, the reaction was, um ... was more than I could have hoped for. It was a long-held ambition of mine to bring down a statistics website due to public demand.
معلوم شد که واکنش آنها بیش از چیزی بود که من امیدش را داشتم. همیشه این جاهطلبی را داشتم که یک وبسایت آماری درست کنم چون تقاضای عمومی برایش بالا بود.
(Laughter)
(خنده)
This URL contains the words "statistics," "gov" and "UK," which are three of people's least favorite words in a URL. And the amazing thing about this was that the website came down at quarter to 10 at night, because people were actually engaging with this data of their own free will, using their own personal time. I was very interested to see that we got something like a quarter of a million people playing the quiz within the space of 48 hours of launching it. And it sparked an enormous discussion online, on social media, which was largely dominated by people having fun with their misconceptions, which is something that I couldn't have hoped for any better, in some respects. I also liked the fact that people started sending it to politicians. How well do you know the area you claim to represent?
این نشانی وبسایت حاوی کلماتی چون "statistics" و "gov" و "UK" است که هر سه از کم طرفدارترین کلمات بین مردم برای نشانی وبسایت است. و جالب این که، این وب سایت در ساعت یک ربع به ۱۰ شب از کار افتاد، برای اینکه مردم درگیر این داده ها شده بودند آن هم با اراده آزاد خود، و با استفاده از وقت شخصیشان. برایم جالب بود که می دیدم چیزی حدود ۲۵۰ هزار نفر در ظرف ۴۸ ساعت پس از راه اندازی وبسایت سرگرم جواب دادن به پرسشنامه هستند. و این جرقه بحثهای آنلاین گسترده ای را در رسانههای اجتماعی زد، که عمدتا در سیطره کسانی بود که با سوءبرداشت های خود تفریح می کردند، این چیزی بود که من نمیتوانستم بهتر از آن را انتظار داشته باشم، در برخی جهات. من همچنین این واقعیت که مردم شروع به ارسال این (آمارها) به سیاستمداران کردند را دوست داشتم. "چقدر شما به خوبی منطقهای که ادعای نمایندگی آن را دارید، میشناسید؟"
(Laughter)
(خنده)
And then just to finish, going back to the two kinds of people, I thought it would be really interesting to see how people who are good with numbers would do on this quiz. The national statistician of England and Wales, John Pullinger, you would expect he would be pretty good. He got 44 for his own area.
و در انتها، به عقب، به دو گروه از افراد برمیگردم، فکر کردم جالب می شود که ببینیم افرادی که حسابشان خوب است در این پرسشنامه چطور کار می کنند. جان پولینگر، کارشناس آمار ملی در انگلیس و ولز، که می دانیم حسابش خوب است. او برای پرسشنامه مربوط به منطقه خودش نمره ۴۴ را گرفت.
(Laughter)
(خنده حضار)
Jeremy Paxman -- admittedly, after a glass of wine -- 36. Even worse. It just shows you that the numbers can inspire us all. They can surprise us all.
جرمی پکسمن (روزنامه نگار و نویسنده) که اعتراف کرده بعد از یک جام شراب به سوالات جواب داده، نمره ۳۶ درصد را گرفت، حتی بدتر از قبلی. این نشان میدهد که اعداد میتوانند الهام بخش ما باشند. آنها میتوانند ما را متعجب کنند.
So very often, we talk about statistics as being the science of uncertainty. My parting thought for today is: actually, statistics is the science of us. And that's why we should be fascinated by numbers.
بنابراین اغلب، ما در مورد آمار به عنوان علم عدم قطعیت صحبت میکنیم. اندیشه آخر من برای امروز: در واقع، آمار علم خودمان است. و به همین دلیل است که ما باید مجذوب اعداد شویم.
Thank you very much.
بسیار متشکرم.
(Applause)
(تشویق حاضران)