Back in 2003, the UK government carried out a survey. And it was a survey that measured levels of numeracy in the population. And they were shocked to find out that for every 100 working age adults in the country, 47 of them lacked Level 1 numeracy skills. Now, Level 1 numeracy skills -- that's low-end GCSE score. It's the ability to deal with fractions, percentages and decimals. So this figure prompted a lot of hand-wringing in Whitehall. Policies were changed, investments were made, and then they ran the survey again in 2011. So can you guess what happened to this number? It went up to 49.
Retrocedamos a 2003, el gobierno del Reino Unido llevó a cabo una encuesta. Y fue una encuesta que medía los niveles de aritmética en la población. Y se sorprendieron al descubrir que por cada 100 adultos en edad laboral en el país, 47 carecían del nivel 1 de aritmética. El nivel 1 de aritmética es la puntuación más baja del puntaje GCSE. Es la capacidad de tratar con fracciones, porcentajes y decimales. Esta cifra generó una gran cantidad de apretones de manos en Whitehall. Se cambiaron las políticas, se realizaron inversiones, y luego hizo una nueva encuesta en 2011. ¿Pueden adivinar lo que le pasó a este número? Subió a 49.
(Laughter)
(Risas)
And in fact, when I reported this figure in the FT, one of our readers joked and said, "This figure is only shocking to 51 percent of the population."
Y de hecho, cuando informé esta cifra en el FT, uno lector bromeó y dijo: "Esta cifra solo es chocante para el 51 % de la población".
(Laughter)
(Risas)
But I preferred, actually, the reaction of a schoolchild when I presented at a school this information, who raised their hand and said, "How do we know that the person who made that number isn't one of the 49 percent either?"
Pero yo prefería, en realidad, la reacción de un escolar cuando presenté en una escuela esta información, quien levantó su mano y dijo: "¿Cómo sabemos que la persona que hizo ese número no es uno del 49 % también?".
(Laughter)
(Risas)
So clearly, there's a numeracy issue, because these are important skills for life, and a lot of the changes that we want to introduce in this century involve us becoming more comfortable with numbers.
Así que, claramente, hay un problema de aritmética, porque estas son habilidades importantes para la vida, y muchos de los cambios que queremos introducir en este siglo involucran que estemos cada vez más cómodos con los números.
Now, it's not just an English problem. OECD this year released some figures looking at numeracy in young people, and leading the way, the USA -- nearly 40 percent of young people in the US have low numeracy. Now, England is there too, but there are seven OECD countries with figures above 20 percent. That is a problem, because it doesn't have to be that way. If you look at the far end of this graph, you can see the Netherlands and Korea are in single figures. So there's definitely a numeracy problem that we want to address.
No es solo un problema inglés. La OCDE este año lanzó algunos datos sobre la aritmética en los jóvenes, y liderando el camino, EE. UU., casi el 40 % de los jóvenes en EE. UU. tienen baja aritmética. Inglaterra está también, pero hay siete países de la OCDE con cifras superiores al 20 %. Esto es un problema, ya que no tiene por qué ser así. Si nos fijamos en el otro extremo del gráfico, pueden ver que Holanda y Corea están en un solo dígito. Definitivamente hay un problema de aritmética que queremos abordar.
Now, as useful as studies like these are, I think we risk herding people inadvertently into one of two categories; that there are two kinds of people: those people that are comfortable with numbers, that can do numbers, and the people who can't. And what I'm trying to talk about here today is to say that I believe that is a false dichotomy. It's not an immutable pairing. I think you don't have to have tremendously high levels of numeracy to be inspired by numbers, and that should be the starting point to the journey ahead.
Tan útiles como son estos estudios, corremos el riesgo de agrupar las personas sin querer en una de dos categorías; que hay dos tipos de personas: aquellas que se sienten cómodas con los números, que pueden hacerlos, y los que no pueden. Y lo que estoy tratando de decirle aquí hoy es que creo que es una falsa dicotomía. No es un emparejamiento inmutable. Creo que uno no tiene que tener un nivel tremendamente alto de aritmética para ser inspirado por los números, y que debería ser el punto de partida para lo que sigue.
And one of the ways in which we can begin that journey, for me, is looking at statistics. Now, I am the first to acknowledge that statistics has got somewhat of an image problem.
Una de las formas en las que podemos empezar ese viaje, para mí, es mirar a la estadística. Soy el primero en reconocer que la estadística tiene algo así como un problema de imagen.
(Laughter)
(Risas)
It's the part of mathematics that even mathematicians don't particularly like, because whereas the rest of maths is all about precision and certainty, statistics is almost the reverse of that. But actually, I was a late convert to the world of statistics myself. If you'd asked my undergraduate professors what two subjects would I be least likely to excel in after university, they'd have told you statistics and computer programming, and yet here I am, about to show you some statistical graphics that I programmed.
Es la parte de las matemáticas que incluso a los matemáticos no nos gusta especialmente, porque mientras que el resto de las matemáticas tratan de precisión y certeza, la estadística es casi lo contrario. Pero, en realidad, soy un converso tardío del mundo de la estadística. Si hubieran preguntado a mis profesores de universidad por dos temas en los que fuera menos propenso a sobresalir al acabar, les habrían dicho estadísticas y programación informática, y sin embargo, aquí estoy, a punto de mostrar gráficos estadísticos que programé.
So what inspired that change in me? What made me think that statistics was actually an interesting thing? It's really because statistics are about us. If you look at the etymology of the word statistics, it's the science of dealing with data about the state or the community that we live in. So statistics are about us as a group, not us as individuals. And I think as social animals, we share this fascination about how we as individuals relate to our groups, to our peers. And statistics in this way are at their most powerful when they surprise us.
¿Qué inspiró el cambio en mí? ¿Qué me hizo pensar que la estadística era en realidad una cosa interesante? Realmente porque las estadísticas son sobre nosotros. Si nos fijamos en la etimología de la palabra estadística, es la ciencia que trata con datos sobre el estado o la comunidad en que vivimos. Así que las estadísticas son acerca de nosotros como grupo, no nosotros como individuos. Creo que como animales sociales, compartimos esta fascinación sobre cómo somos como individuos en relación con nuestros grupos y compañeros. Y las estadísticas en esta vía están en su mayor potencia cuando nos sorprenden.
And there's been some really wonderful surveys carried out recently by Ipsos MORI in the last few years. They did a survey of over 1,000 adults in the UK, and said, for every 100 people in England and Wales, how many of them are Muslim? Now the average answer from this survey, which was supposed to be representative of the total population, was 24. That's what people thought. British people think 24 out of every 100 people in the country are Muslim. Now, official figures reveal that figure to be about five. So there's this big variation between what we think, our perception, and the reality as given by statistics. And I think that's interesting. What could possibly be causing that misperception?
Ha habido algunas encuestas realmente maravillosas recientemente por Ipsos MORI en los últimos años. Hicieron un estudio de más de 1000 adultos en el Reino Unido, y dicen que, de cada 100 personas en Inglaterra y Gales, ¿cuántas son musulmanes? Ahora la respuesta media de esta encuesta, que se supone que es representativa de la población total, fue de 24. Eso es lo que la gente pensaba. Los británicos piensan 24 de cada 100 personas en el país son musulmanes. Ahora, las cifras oficiales revelan que el número es 5. Así que hay esta gran variación entre lo que pensamos, nuestra percepción, y la realidad dada por las estadísticas. Creo que eso es interesante. ¿Qué podría ser posiblemente la causa de la percepción errónea?
And I was so thrilled with this study, I started to take questions out in presentations. I was referring to it. Now, I did a presentation at St. Paul's School for Girls in Hammersmith, and I had an audience rather like this, except it was comprised entirely of sixth-form girls. And I said, "Girls, how many teenage girls do you think the British public think get pregnant every year?" And the girls were apoplectic when I said the British public think that 15 out of every 100 teenage girls get pregnant in the year. And they had every right to be angry, because in fact, I'd have to have closer to 200 dots before I could color one in, in terms of what the official figures tell us.
Estaba tan encantado con este estudio, que empecé a tomar preguntas en presentaciones. Me refería a ella. Hice una presentación en la Escuela St. Paul de niñas en Hammersmith, y tenía un público más o menos como este, excepto que estaba compuesto en su totalidad de niñas de 17 años. Dije: "Niñas, ¿cuántas chicas adolescentes creen que el público británico piensa que quedan embarazadas cada año?". Y las chicas se exaltaron cuando dije que el público británico considera que 15 de cada 100 adolescentes quedaban embarazadas al año. Y tenían todo el derecho de estar enojadas, porque, de hecho, tendría que tener cerca de 200 puntos antes de poder colorear uno de estos, en términos de lo que las cifras oficiales nos dicen.
And rather like numeracy, this is not just an English problem. Ipsos MORI expanded the survey in recent years to go across the world. And so, they asked Saudi Arabians, for every 100 adults in your country, how many of them are overweight or obese? And the average answer from the Saudis was just over a quarter. That's what they thought. Just over a quarter of adults are overweight or obese. The official figures show, actually, it's nearer to three-quarters.
Y como la aritmética, esto no es solo un problema inglés. Ipsos MORI amplió la encuesta en los últimos años al otro lado del mundo. Y así, pidieron a los saudíes, por cada 100 adultos en su país, ¿cuántos de ellos tienen sobrepeso o son obesos? Y la respuesta promedio de los saudís fue de poco más de un cuarto. Eso es lo que pensaban. Poco más de un cuarto tienen sobrepeso o son obesos. Las cifras oficiales muestran, en realidad, están más cerca de tres cuartos.
(Laughter)
(Risas)
So again, a big variation.
De nuevo, una gran variación.
And I love this one: they asked in Japan, they asked the Japanese, for every 100 Japanese people, how many of them live in rural areas? The average was about a 50-50 split, just over halfway. They thought 56 out of every 100 Japanese people lived in rural areas. The official figure is seven.
Y amo a éste: que pidieron en Japón, pidieron a los japoneses, por cada 100 personas japonesas, ¿cuántos viven en zonas rurales? El promedio fue de alrededor de un 50-50, poco más de la mitad. Pensaron que 56 de cada 100 japoneses vivían en zonas rurales. La cifra oficial es de siete.
So extraordinary variations, and surprising to some, but not surprising to people who have read the work of Daniel Kahneman, for example, the Nobel-winning economist. He and his colleague, Amos Tversky, spent years researching this disjoint between what people perceive and the reality, the fact that people are actually pretty poor intuitive statisticians. And there are many reasons for this. Individual experiences, certainly, can influence our perceptions, but so, too, can things like the media reporting things by exception, rather than what's normal. Kahneman had a nice way of referring to that. He said, "We can be blind to the obvious" -- so we've got the numbers wrong -- "but we can be blind to our blindness about it." And that has enormous repercussions for decision making.
Así, las variaciones extraordinarias y sorprendente para algunos, pero no es extraño para quienes han leído la obra de Daniel Kahneman, por ejemplo, ganador del Nobel de economía. Él y su colega, Amos Tversky, pasaron años investigando esta desconexión entre lo que la gente percibe y la realidad, el que las personas son realmente muy malos estadísticos intuitivos. Y hay muchas razones para ello. Las experiencias individuales, sin duda, pueden influir nuestra percepción, pero también, cosas como los informes de los medios de la excepción, en lugar de lo que es normal. Kahneman tenía una manera de referirse a eso. "Podemos cerrar los ojos a lo evidente" --tener un número equivocado-- "pero podemos estar ciegos a nuestra ceguera al respecto". Y esto tiene enormes repercusiones para la toma de decisiones.
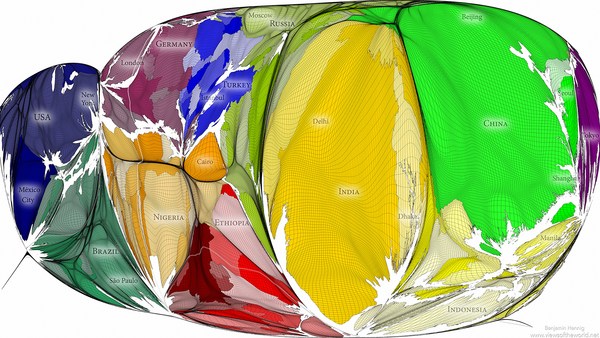
So at the statistics office while this was all going on, I thought this was really interesting. I said, this is clearly a global problem, but maybe geography is the issue here. These were questions that were all about, how well do you know your country? So in this case, it's how well do you know 64 million people? Not very well, it turns out. I can't do that. So I had an idea, which was to think about this same sort of approach but to think about it in a very local sense. Is this a local? If we reframe the questions and say, how well do you know your local area, would your answers be any more accurate?
En la oficina de estadísticas, mientras esto pasaba, me pareció que era muy interesante. Dije que claramente es un problema global, pero tal vez la geografía es la cuestión aquí. Todas estas preguntas eran de, ¿qué tan bien conoce su país? Así que en este caso, ¿qué tan bien conoces 64 millones de personas? Resulta que no muy bien. No puedo hacer eso. Así que tuve una idea, que consistía en pensar en este mismo tipo de enfoque pero pensar en ello en un sentido muy local. ¿Es esto local? Si reformulamos las preguntas y decir, ¿qué tan bien conoce su área local, serían sus respuestas más precisas?
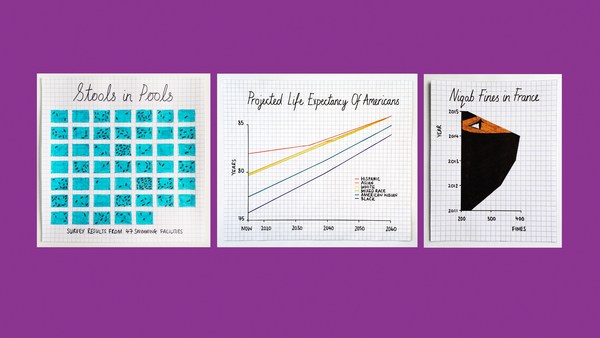
So I devised a quiz: How well do you know your area? It's a simple Web app. You put in a post code and then it will ask you questions based on census data for your local area. And I was very conscious in designing this. I wanted to make it open to the widest possible range of people, not just the 49 percent who can get the numbers. I wanted everyone to engage with it. So for the design of the quiz, I was inspired by the isotypes of Otto Neurath from the 1920s and '30s. Now, these are methods for representing numbers using repeating icons. And the numbers are there, but they sit in the background. So it's a great way of representing quantity without resorting to using terms like "percentage," "fractions" and "ratios."
Así que ideé un cuestionario: ¿Qué tan bien conoce su área? Es una sencilla aplicación Web. Ponen un código postal y luego le hará preguntas sobre la base de los datos del censo de su área local. Y yo era muy consciente en este diseño. Quería hacerla abierta al mayor número posible de personas, No solo el 49 % que se puede obtener los números. Quería que todos se unieran. Así, para el diseño del cuestionario, me inspiré en los isotipos de Otto Neurath a partir de los años 1920 y 30. Estos son métodos para representar los números mediante repetición de iconos. Y los números están ahí, pero se sientan en el fondo. Así que es una gran manera de representar cantidades sin recurrir al uso de términos como "porcentaje" "fracciones" y "relaciones".
So here's the quiz. The layout of the quiz is, you have your repeating icons on the left-hand side there, and a map showing you the area we're asking you questions about on the right-hand side. There are seven questions. Each question, there's a possible answer between zero and a hundred, and at the end of the quiz, you get an overall score between zero and a hundred. And so because this is TEDxExeter, I thought we would have a quick look at the quiz for the first few questions of Exeter. And so the first question is: For every 100 people, how many are aged under 16? Now, I don't know Exeter very well at all, so I had a guess at this, but it gives you an idea of how this quiz works. You drag the slider to highlight your icons, and then just click "Submit" to answer, and we animate away the difference between your answer and reality. And it turns out, I was a pretty terrible guess: five.
Aquí está la prueba. El diseño de la prueba es, deben repetir los iconos en la parte izquierda de allí, y un mapa que muestra el área en la que a uno le están preguntando al lado derecho. Hay siete preguntas. En cada pregunta, hay una posible respuesta entre 0 y 100, y, al final de la prueba, se obtiene una puntuación total entre 0 y 100. Y como este es TEDxExeter, creí que sería bueno ver rápidamente la prueba de las primeras preguntas de Exeter. La primera pregunta es: Por cada 100 personas, ¿cuántos son menores de 16 años? Ahora, no conozco Exeter muy bien, así que tenía una pista sobre esto, pero te da una idea de cómo funciona esta prueba. Arrastren el cursor para resaltar sus iconos, y luego hagan clic en "Enviar" para contestar, y animemos la diferencia entre la respuesta y la realidad. Y resulta que hice una conjetura bastante terrible: cinco.
How about the next question? This is asking about what the average age is, so the age at which half the population are younger and half the population are older. And I thought 35 -- that sounds middle-aged to me.
¿Qué hay de la siguiente? Esta pregunta por la edad media, la edad en la que la mitad de la población es menor y la mitad mayor. Y pensé 35 --que a mí me suena edad mediana--.
(Laughter)
(Risas)
Actually, in Exeter, it's incredibly young, and I had underestimated the impact of the university in this area. The questions get harder as you go through. So this one's now asking about homeownership: For every 100 households, how many are owned with a mortgage or loan? And I hedged my bets here, because I didn't want to be more than 50 out on the answer.
En realidad, Exeter, es increíblemente joven, y yo había subestimado el impacto de la universidad en esta área. Las preguntas se dificultan al avanzar. Esta ahora pregunta por la propiedad de vivienda: Por cada 100 hogares, ¿cuántos son de propiedad con una hipoteca o préstamo? Y fui sobre seguro aquí, porque no quería estar equivocado en más de 50 en la respuesta.
(Laughter)
(Risas)
And actually, these get harder, these questions, because when you're in an area, when you're in a community, things like age -- there are clues to whether a population is old or young. Just by looking around the area, you can see it. Something like homeownership is much more difficult to see, so we revert to our own heuristics, our own biases about how many people we think own their own homes.
Y, de hecho, se hacen más difíciles estas preguntas, porque cuando estás en un área, en una comunidad, de cosas como la edad hay pistas si la población es joven o vieja. Con solo mirar por la zona, se puede ver. Algo como la propiedad de vivienda es mucho más difícil de ver, por lo que volvemos a nuestros heurísticos, nuestros prejuicios sobre cuántos creemos que son dueños de sus hogares.
Now the truth is, when we published this quiz, the census data that it's based on was already a few years old. We've had online applications that allow you to put in a post code and get statistics back for years. So in some senses, this was all a little bit old and not necessarily new. But I was interested to see what reaction we might get by gamifying the data in the way that we have, by using animation and playing on the fact that people have their own preconceptions.
Ahora, la verdad es que, cuando publicamos este cuestionario, los datos del censo en que se basa ya eran de un par de años atrás. Hemos tenido aplicaciones en línea que permiten poner en un código postal y obtener estadísticas anteriores de años. En algunos sentidos, todo esto era un poco viejo y no necesariamente nueva. Pero yo estaba interesado en ver qué reacción se consigue volviendo juego los datos en la forma que los tenemos, mediante el uso de animación y el hecho de que las personas tienen sus propias ideas preconcebidas.
It turns out, the reaction was, um ... was more than I could have hoped for. It was a long-held ambition of mine to bring down a statistics website due to public demand.
Resulta que, la reacción fue, um... fue más de lo que podía haber esperado. Era una ambición de larga data mía bajar una página web estadística por la demanda del público.
(Laughter)
(Risas)
This URL contains the words "statistics," "gov" and "UK," which are three of people's least favorite words in a URL. And the amazing thing about this was that the website came down at quarter to 10 at night, because people were actually engaging with this data of their own free will, using their own personal time. I was very interested to see that we got something like a quarter of a million people playing the quiz within the space of 48 hours of launching it. And it sparked an enormous discussion online, on social media, which was largely dominated by people having fun with their misconceptions, which is something that I couldn't have hoped for any better, in some respects. I also liked the fact that people started sending it to politicians. How well do you know the area you claim to represent?
Esta URL contiene las palabras "estadísticas", "gov" y "Reino Unido" 3 de las palabras menos favoritas de la gente en una dirección URL. Y lo sorprendente de esto fue que el sitio web descendió al cuarto para las 10 de la noche, porque la gente estaba realmente interactuando con estos datos por su propia voluntad, usando su propio tiempo personal. Yo estaba muy interesado en ver que lográramos algo así como un cuarto de millón de personas jugando con el cuestionario en el plazo de 48 horas de lanzada. Y se desencadenó una enorme discusión en línea, en las redes sociales, que fue dominada en gran parte por personas que se divierten con sus conceptos erróneos, que es algo que no podía haber esperado mejor, en ciertos sentidos. También me gustó que la gente comenzó a enviársela a los políticos. ¿Qué tan bien conoce el área que dicen representar?
(Laughter)
(Risas)
And then just to finish, going back to the two kinds of people, I thought it would be really interesting to see how people who are good with numbers would do on this quiz. The national statistician of England and Wales, John Pullinger, you would expect he would be pretty good. He got 44 for his own area.
A continuación para terminar, remontándonos a las dos clases de personas, pensé que sería muy interesante ver cómo las personas buenas con los números hacían la prueba. Del estadístico nacional de Inglaterra y Gales, John Pullinger, se podía esperar que fuera bastante bueno. Obtuvo 44 en su propia área.
(Laughter)
(Risas)
Jeremy Paxman -- admittedly, after a glass of wine -- 36. Even worse. It just shows you that the numbers can inspire us all. They can surprise us all.
Jeremy Paxman --ciertamente, después de una copa de vino-- 36. Peor aún. Simplemente muestra que los números nos pueden inspirar. Nos pueden sorprender.
So very often, we talk about statistics as being the science of uncertainty. My parting thought for today is: actually, statistics is the science of us. And that's why we should be fascinated by numbers.
Muy a menudo, hablamos de la estadística como de la ciencia de la incertidumbre. Me pensamiento de despedida para hoy: En realidad, la estadística es la ciencia de nosotros. Y por eso que deberíamos estar fascinados con los números.
Thank you very much.
Muchas gracias.
(Applause)
(Aplausos)