بالعودة الي عام 2003، قامت الحكومة البريطانية بعمل استطلاع رأي. كان الاستطلاع يقيس مستوى الإلمام بعلم الحساب بين السكان. وكانت صدمة بالنسبة لهم عند معرفة أن بين كل 100 شخص في سن العمل في البلاد، 47 منهم يفتقرون إلى المستوى 1 للمهارات الحسابية. المستوى 1 للمهارات الحسابية -- درجة أدنى من شهادة إتمام الثانوية العامة. إنها القدرة على التعامل مع الكسور والنسب والكسور العشرية. فأثارت هذه الأرقام القلق في وايت هول. تغييرت السياسات، وقدمت الاستثمارات، ثم قاموا بإجراء دراسة أخرى في عام 2011. يمكنكم تخمين ما حدث لهذا العدد؟ ارتفع إلى 49.
Back in 2003, the UK government carried out a survey. And it was a survey that measured levels of numeracy in the population. And they were shocked to find out that for every 100 working age adults in the country, 47 of them lacked Level 1 numeracy skills. Now, Level 1 numeracy skills -- that's low-end GCSE score. It's the ability to deal with fractions, percentages and decimals. So this figure prompted a lot of hand-wringing in Whitehall. Policies were changed, investments were made, and then they ran the survey again in 2011. So can you guess what happened to this number? It went up to 49.
(ضحك)
(Laughter)
وفي الواقع، عندما ذكرت هذا الرقم في فاينانشال تايمز، مزح أحد القراء وقال: "يُعد هذا الرقم صدمة بالنسبة إلى 51 بالمئة فقط من السكان."
And in fact, when I reported this figure in the FT, one of our readers joked and said, "This figure is only shocking to 51 percent of the population."
(ضحك)
(Laughter)
ولكن أفضل، في الواقع، رد فعل تلميذ عندما قمت بتقديم هذه المعلومات في مدرسة، قام برفع يده، وقال: "كيف يمكن أن نتأكد أن الشخص الذي وضع هذا العدد ليس واحدا من 49 بالمئة؟"
But I preferred, actually, the reaction of a schoolchild when I presented at a school this information, who raised their hand and said, "How do we know that the person who made that number isn't one of the 49 percent either?"
(ضحك)
(Laughter)
بشكل واضح، يوجد مشكلة مرتبطة بالحساب، لأنها تعد من المهارات المهمة للحياة، وتشمل الكثير من التغييرات التي نريد تقديمها في هذا القرن لجعلنا أكثر راحة مع الأرقام.
So clearly, there's a numeracy issue, because these are important skills for life, and a lot of the changes that we want to introduce in this century involve us becoming more comfortable with numbers.
الآن، هذه ليست مجرد مشكلة إنجليزية. أصدرت منظمة التعاون والتنمية هذا العام بعض الأرقام حول أساسيات الحساب لدى الشباب، تتصدر القائمة، الولايات المتحدة الأمريكية -- ما يقرب 40 بالمئة من الشباب في الولايات المتحدة ذوي معرفة حسابية منخفضة. كما انضمت انجلترا، ولكن هناك سبع دول من منظمة التعاون والتنمية بنسبة تفوت 20 بالمئة. هذه مشكلة، لأنه لا يجب أن يكون الأمر بهذه الطريقة. إذا ما نظرتم إلى آخر هذا الرسم البياني، تستطيع أن ترى أن هولندا وكوريا تتكون من رقم واحد. ولذلك يوجد بالتأكيد مشكلة بشأن علوم الحساب نريد حلّها.
Now, it's not just an English problem. OECD this year released some figures looking at numeracy in young people, and leading the way, the USA -- nearly 40 percent of young people in the US have low numeracy. Now, England is there too, but there are seven OECD countries with figures above 20 percent. That is a problem, because it doesn't have to be that way. If you look at the far end of this graph, you can see the Netherlands and Korea are in single figures. So there's definitely a numeracy problem that we want to address.
بمثل إفادة دراسات كهذه، أعتقد أننا نخاطر عن غير قصد بتصنيف الناس في واحدة من مجموعتين، يوجد نوعان من الناس: أولئك الذين يشعرون بالراحة مع الأرقام، ويمكنهم التعامل معها، وأولئك الذين لا يمكنهم التعامل معها. وما أحاول التحدث عنه هنا اليوم هو القول إنني أؤمن بأن هذا تصنيف زائف. ليس اقتراناً ثابتاً. أعتقد أنه لا ينبغي عليك أن تتمتع بمستويات عالية جدا من المهارات الحسابية لتلهمك الأرقام، وينبغي أن يكون ذلك نقطة الانطلاق إلى الرحلة القادمة.
Now, as useful as studies like these are, I think we risk herding people inadvertently into one of two categories; that there are two kinds of people: those people that are comfortable with numbers, that can do numbers, and the people who can't. And what I'm trying to talk about here today is to say that I believe that is a false dichotomy. It's not an immutable pairing. I think you don't have to have tremendously high levels of numeracy to be inspired by numbers, and that should be the starting point to the journey ahead.
توجد طريقة واحدة يمكننا من خلالها بدء هذه الرحلة، بالنسبة لي، هي الاطلاع على الإحصائيات. الآن، أنا أول من يعترف أن الإحصاءات قد حصلت إلى حد ما على صورة نمطية سيئة.
And one of the ways in which we can begin that journey, for me, is looking at statistics. Now, I am the first to acknowledge that statistics has got somewhat of an image problem.
(ضحك)
(Laughter)
إنها جزء من الرياضيات حتى أنّ علماء الرياضيات لا يحبونها بشكل خاص، لأنه بينما تتمحور بقية الرياضيات حول الدقة واليقين، الإحصائيات عكس ذلك تمامًا. ولكن في الحقيقة، تحولت إلى عالم إحصاء في وقت متأخر. إذا سألت أساتذتي قبل تخرجي عن أكثر مجالين على الأرجح قد أفشل فيهما بعد الجامعة لكانوا سيخبرونك الإحصاءات وبرمجة الكمبيوتر، ها أنا هنا، على وشك تقديم بعض الرسومات الإحصائية التي قمت ببرمجتها.
It's the part of mathematics that even mathematicians don't particularly like, because whereas the rest of maths is all about precision and certainty, statistics is almost the reverse of that. But actually, I was a late convert to the world of statistics myself. If you'd asked my undergraduate professors what two subjects would I be least likely to excel in after university, they'd have told you statistics and computer programming, and yet here I am, about to show you some statistical graphics that I programmed.
ما الذي كان مصدر إلهاما لتغيير نفسي؟ ما الذي جعلني أعتقد أن الإحصاء في الواقع أمر مثيرٌ للاهتمام؟ لأن الإحصاء يتمحور حولنا. إذا نظرتم إلى أصل كلمة علم الإحصاء أو الإحصائيات، تعني علم التعامل مع البيانات عن الدولة أو المجتمع الذي نعيش فيه. تتمحور الإحصائيات حولنا كمجموعة وليس كأفراد. أعتقد كأشخاص اجتماعيين أننا نشاطر هذا الولع حول كيفية اتصالنا كأفراد مع مجموعاتنا إلى أقراننا. وتعد الإحصاءات بهذه الطريقة في أشد قوتها عندما تفاجئنا.
So what inspired that change in me? What made me think that statistics was actually an interesting thing? It's really because statistics are about us. If you look at the etymology of the word statistics, it's the science of dealing with data about the state or the community that we live in. So statistics are about us as a group, not us as individuals. And I think as social animals, we share this fascination about how we as individuals relate to our groups, to our peers. And statistics in this way are at their most powerful when they surprise us.
كان هناك عدد من الاستبيانات الرائعة حقا تم إجراءها في الآونة الأخيرة من قبل ايبسوس موري في السنوات الأخيرة قاموا بإستبيان مع أكثر من 1000 بالغ في المملكة المتحدة، وسألوا، لكل 100 شخص في انكلترا وويلز، كم منهم مسلم؟ متوسط الإجابة من هذا الاستبيان، كان من المفترض أن يكون ممثلاً من مجموع عدد السكان، كان 24 هذا ما اعتقده الناس الشعب البريطاني يعتقد ان 24 من كل 100 شخص في البلاد مسلمون. الآن، الأرقام الرسمية تكشف أن هذا الرقم هو حوالي خمسة. هذا الفارق الكبير بين ما نعتقده، تصورنا والواقع اللذي تخبرنا به الاحصاءات. وأعتقد أن هذا مثير للاهتمام، ما الذي قد يكون سبب سوء الفهم هذا؟
And there's been some really wonderful surveys carried out recently by Ipsos MORI in the last few years. They did a survey of over 1,000 adults in the UK, and said, for every 100 people in England and Wales, how many of them are Muslim? Now the average answer from this survey, which was supposed to be representative of the total population, was 24. That's what people thought. British people think 24 out of every 100 people in the country are Muslim. Now, official figures reveal that figure to be about five. So there's this big variation between what we think, our perception, and the reality as given by statistics. And I think that's interesting. What could possibly be causing that misperception?
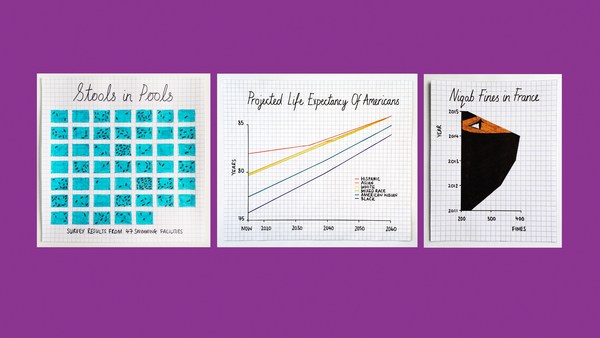
كنت سعيدًا جدًا بهذه الدراسة بدأت في طرح الأسئلة في العروض التقديمية. التي اشرت اليها الآن، لقد قدمت عرضًا في مدرسة سانت بول للبنات في هامرسميث، وكان لي جمهور مثل هذا إلا أنها كانت تتألف بالكامل من الفتيات في المرحلة الثانوية. وقلت "فتيات، كم عدد الفتيات المراهقات في رأيكن يعتقد البريطانيون أنهن حوامل في كل عام؟" وكانت الفتيات مصدومات عندما قلت بأن البريطانين يعتقدون ان 15 من كل 100 فتاة مراهقة تصبح حاملًا في السنة ولهم كل الحق في الغضب، لأنه في الواقع، يجب أن يكون أقرب إلى 200 نقطة قبل أن أتمكن من تلوين واحد فقط وفقا لما تخبرنا به الأرقام الرسمية.
And I was so thrilled with this study, I started to take questions out in presentations. I was referring to it. Now, I did a presentation at St. Paul's School for Girls in Hammersmith, and I had an audience rather like this, except it was comprised entirely of sixth-form girls. And I said, "Girls, how many teenage girls do you think the British public think get pregnant every year?" And the girls were apoplectic when I said the British public think that 15 out of every 100 teenage girls get pregnant in the year. And they had every right to be angry, because in fact, I'd have to have closer to 200 dots before I could color one in, in terms of what the official figures tell us.
علي غرار الحساب، هذه ليست مجرد مشكلة إنجليزية. وسعت إيبسوس موري المسح في السنوات الأخيرة ليكون حول العالم. ولذلك سألوا السعوديين لكل 100 شخص بالغ في بلدك، كم منهم يعاني من زيادة الوزن أو السمنة؟ ومتوسط إجابات السعوديين كان أكثر بقليل من الربع. هذا ما كانوا يعتقدونه أكثر بقليل من ربع البالغين يعاني زيادة الوزن أو السمنة. وتظهر الأرقام الرسمية، أنها في الواقع أقرب إلى ثلاثة أرباع.
And rather like numeracy, this is not just an English problem. Ipsos MORI expanded the survey in recent years to go across the world. And so, they asked Saudi Arabians, for every 100 adults in your country, how many of them are overweight or obese? And the average answer from the Saudis was just over a quarter. That's what they thought. Just over a quarter of adults are overweight or obese. The official figures show, actually, it's nearer to three-quarters.
(ضحك)
(Laughter)
مرة أخرى، تباين كبير.
So again, a big variation.
وأنا أحب هذا المثال: في اليابان سألوا اليابانيين لكل 100 شخص ياباني كم شخصًا منهم يعيش في المناطق الريفية؟ وكان المتوسط حوالي اكثرمن 50 بالمئة بقليل. اعتقدوا أن 56 من كل 100 شخص يعيش في المناطق الريفية. الرقم الرسمي هو سبعة.
And I love this one: they asked in Japan, they asked the Japanese, for every 100 Japanese people, how many of them live in rural areas? The average was about a 50-50 split, just over halfway. They thought 56 out of every 100 Japanese people lived in rural areas. The official figure is seven.
تباين كبير للغاية، مثير للدهشة للبعض ولكن ليس مستغربًا للذين قرأوا أعمال دانيال كانيمان على سبيل المثال، الإقتصادي الحائز على جائزة نوبل. هو وزميله أموس تفرسكي، أمضوا سنوات من البحث في هذا الاختلاف بين ما يظنه الناس والواقع، حقيقة أن الناس في الواقع سيئين جدًا في الإحصاءات الحدسية. وهناك أسباب كثيرة لذلك. التجارب الفردية، بالتأكيد يمكن أن تؤثر على تصوراتنا ولكن يمكن لأمور مثل إعلان وسائل الإعلام عن الأشياء الاستثنائية، بدلًا من ما هو طبيعي. كانيمان له طريقة لطيفة في الإشارة إلى ذلك قال: "يمكن أن نكون عميانًا إلى ما هو واضح" لذلك لدينا أرقام خاطئة "ولكن يمكن أن نكون عميان لعمينا حيال ذلك " وهذا له تداعيات هائلة في اتخاذ القرار.
So extraordinary variations, and surprising to some, but not surprising to people who have read the work of Daniel Kahneman, for example, the Nobel-winning economist. He and his colleague, Amos Tversky, spent years researching this disjoint between what people perceive and the reality, the fact that people are actually pretty poor intuitive statisticians. And there are many reasons for this. Individual experiences, certainly, can influence our perceptions, but so, too, can things like the media reporting things by exception, rather than what's normal. Kahneman had a nice way of referring to that. He said, "We can be blind to the obvious" -- so we've got the numbers wrong -- "but we can be blind to our blindness about it." And that has enormous repercussions for decision making.
حتى في مكتب الإحصاءات بينما كان هذا كله يحدث، اعتقدت أن هذا مثير للاهتمام حقًا. قلت من الواضح أنها مشكلة عالمية، ولكن ربما الجغرافيا هي القضية هنا. وكانت هذه أسئلة تدور كلها حول مدى معرفتك ببلدك؟ لذلك في هذه الحالة، ما مدى معرفتك بـ 64 مليون شخص؟ ليس جيدًا علي ما يبدو، لا أستطيع أن أفعل ذلك. لذلك كان لدي فكرة والتي كانت التفكير علي نفس النهج ولكن بطريقة محلية. هل هذا محلي؟ إذا قمنا بإعادة صياغة الأسئلة وسألنا ما مدى معرفتك بمنطقثك المحلية هل ستكون إجاباتك أكثر دقة؟
So at the statistics office while this was all going on, I thought this was really interesting. I said, this is clearly a global problem, but maybe geography is the issue here. These were questions that were all about, how well do you know your country? So in this case, it's how well do you know 64 million people? Not very well, it turns out. I can't do that. So I had an idea, which was to think about this same sort of approach but to think about it in a very local sense. Is this a local? If we reframe the questions and say, how well do you know your local area, would your answers be any more accurate?
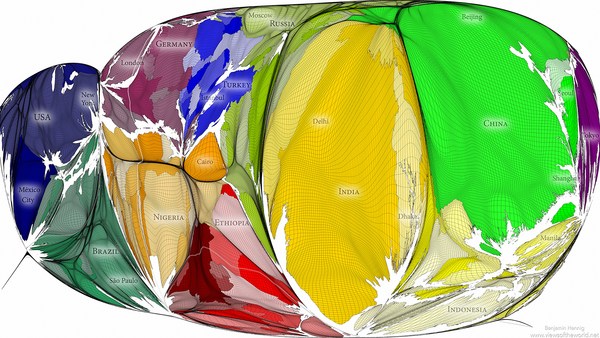
لذلك ابتكرت اختبارً: ما درجة معرفتك بمنطقتك؟ انه تطبيق بسيط على شبكة الإنترنت. أنت تدخل الرقم البريدي وبعد ذلك سوف يسألك أسئلة استناًدا على بيانات الاحصاء في منطقتك. وكنت واعيًا جدًا عند تصميمه. أردت أن أجعله مفتوحًا إلى أوسع نطاق ممكن من الناس، وليس فقط 49 في المئة الذين يمكنهم التعامل مع الأرقام. أردت أن يتفاعل الجميع معه. لذا من أجل تصميم هذا الاختبار، كان مستوحى من أنماط أوتو نيوراث بالعشرينيات والثلاثينيات. وهي أساليب لتمثيل الأرقام باستخدام الرموز المتكررة. والأرقام موجودة ولكن في الخلفية. لذلك فهي طريقة رائعة لتمثيل الكمية دون اللجوء إلى استخدام المصطلحات مثل "النسبة المئوية"، "الكسور" و "النسب".
So I devised a quiz: How well do you know your area? It's a simple Web app. You put in a post code and then it will ask you questions based on census data for your local area. And I was very conscious in designing this. I wanted to make it open to the widest possible range of people, not just the 49 percent who can get the numbers. I wanted everyone to engage with it. So for the design of the quiz, I was inspired by the isotypes of Otto Neurath from the 1920s and '30s. Now, these are methods for representing numbers using repeating icons. And the numbers are there, but they sit in the background. So it's a great way of representing quantity without resorting to using terms like "percentage," "fractions" and "ratios."
هذا هو الاختبار. تصميم هذا الاختبار يعتمد علي، لديك رمزك المتكرر على الجانب الأيسر، وخريطة تظهر لك المنطقة التي نطرح عليك أسئلة حولها على الجانب الأيمن، هناك سبعة أسئلة. لكل سؤال هناك إجابة ممكنة بين 0 و 100 وفي نهاية هذا الاختبار، تحصل على النتيجة الإجمالية بين 0 و 100. وذلك لأن هذا هو TEDxExeter اعتقدت أنه يمكننا القاء نظرة سريعة على الاختبار بالنسبة للأسئلة القليلة الأولى حول إكزتر. هكذا فإن السؤال الأول هو لكل 100 شخص، كم من هم دون سن 16 عامًا؟ الآن، أنا لا أعرف إكزتر بشكل جيد على الإطلاق لذلك إضطررت للتخمين، ولكنها تعطيك فكرة عن كيفية عمل هذا الاختبار. يمكنك سحب شريط التمرير لتسليط الضوء على الرموز الخاصة بك ثم اضغط على إرسال للإجابة، ونحن نعرض لك الفرق بين إجابتك والواقع. واتضح أن تخميني كان فظيعًا: خمسة.
So here's the quiz. The layout of the quiz is, you have your repeating icons on the left-hand side there, and a map showing you the area we're asking you questions about on the right-hand side. There are seven questions. Each question, there's a possible answer between zero and a hundred, and at the end of the quiz, you get an overall score between zero and a hundred. And so because this is TEDxExeter, I thought we would have a quick look at the quiz for the first few questions of Exeter. And so the first question is: For every 100 people, how many are aged under 16? Now, I don't know Exeter very well at all, so I had a guess at this, but it gives you an idea of how this quiz works. You drag the slider to highlight your icons, and then just click "Submit" to answer, and we animate away the difference between your answer and reality. And it turns out, I was a pretty terrible guess: five.
ماذا عن السؤال التالي؟ يسأل عن متوسط الأعمار، أي أن العمر الذي يكون نصف السكان أصغر سنًا ونصف السكان أكبر سنًا. أعتقد 35 - يبدو في منتصف العمر بالنسبة لي.
How about the next question? This is asking about what the average age is, so the age at which half the population are younger and half the population are older. And I thought 35 -- that sounds middle-aged to me.
(ضحك)
(Laughter)
في الواقع، في إكزتر أصغر بشكل لا يصدق، وكنت قد قللت من تأثير الجامعة في هذا المنطقة. الأسئلة تزداد صعوبة كلما نمضي. لذلك هذا يسأل عن ملكية المنازل لكل 100 أسرة، كم عدد المنازل المملوكة برهن عقاري أو قرض؟ وقد أخذت حذري هنا، لأنني لا أريد أن يكون جوابي خاطئًا بأكثر من 50.
Actually, in Exeter, it's incredibly young, and I had underestimated the impact of the university in this area. The questions get harder as you go through. So this one's now asking about homeownership: For every 100 households, how many are owned with a mortgage or loan? And I hedged my bets here, because I didn't want to be more than 50 out on the answer.
(ضحك)
(Laughter)
وفي الواقع، تزداد هذه الأسئلة صعوبة، لأنه عندما تكون في منطقة عندما تكون في مجتمع أشياء مثل العمر - هناك تلميحات ما إذا كان السكان من كبار السن أو الشباب، فقط من خلال النظر في المنطقة، يمكنك أن ترى ذلك. شيء مثل ملكية البيت هو أكثر صعوبة بكثير، لذلك نعود إلى الاستدلالات الخاصة بنا تحيزاتنا الخاصة حول كم من الناس نحن نعتقد أنهم يملكون منازلهم.
And actually, these get harder, these questions, because when you're in an area, when you're in a community, things like age -- there are clues to whether a population is old or young. Just by looking around the area, you can see it. Something like homeownership is much more difficult to see, so we revert to our own heuristics, our own biases about how many people we think own their own homes.
لآنه في الحقيقة عندما نشرنا هذا الاختبار، بيانات التعداد التي يقوم عليها كانت منذ بضع سنوات. كان لدينا تطبيقات عبر الإنترنت التي تسمح لك بوضع الرمز البريدي والحصول على الإحصاءات منذ عدة سنوات. لذا فى بعض النواحى، كان هذا شيء قديم قليلًا وليس بالضرورة جديد. ولكن كنت مهتمًا أن أرى ردود الفعل التي نحصل عليها من جعل هذه البيانات على شكل ألعاب بالطريقة التي رأيناها، باستخدام الرسوم المتحركة واللعب على واقع أن الناس لديهم تصوراتهم الخاصة.
Now the truth is, when we published this quiz, the census data that it's based on was already a few years old. We've had online applications that allow you to put in a post code and get statistics back for years. So in some senses, this was all a little bit old and not necessarily new. But I was interested to see what reaction we might get by gamifying the data in the way that we have, by using animation and playing on the fact that people have their own preconceptions.
اتضح أن رد الفعل كان كان أكثر مما كنت أتمنى. لقد كان طموحًا طال أمده لإسقاط موقع الإحصاءات بسبب ازدياد الطلب العام.
It turns out, the reaction was, um ... was more than I could have hoped for. It was a long-held ambition of mine to bring down a statistics website due to public demand.
(ضحك)
(Laughter)
يحتوي الرابط على هذه الكلمات (الإحصاءات) و(حكومة) و(المملكة المتحدة)، والتي هي ثلاثة من أقل الكلمات المفضلة في روابط البحث. والشيء المدهش حول هذا هو أن الموقع قد تعطل قي العاشرة إلا ربع مساءً، لأن الناس كانوا منخرطين مع هذه البيانات بإرادتهم الحرة، مستخدمين وقتهم الشخصي. كنت مهتمًا جدًا أن أرى أن حصلنا علي شيء مثل ربع مليون شخص يقومون بالاختبار فى غضون 48 ساعة من إطلاقه. وأثارت مناقشة هائلة على شبكة الإنترنت وعلى وسائل التواصل الاجتماعية، الذي كان يهيمن عليه إلى حد كبير من قبل الناس يلهون مع مفاهيمهم الخاطئة وهو شيء لم أكن آمل أفضل منه، في بعض النواحي. أحب أيضًا حقيقة أن الناس بدئوا في إرسالها إلى السياسيين. ما جودة معرفتك بالمنطقة التي تمثلها؟
This URL contains the words "statistics," "gov" and "UK," which are three of people's least favorite words in a URL. And the amazing thing about this was that the website came down at quarter to 10 at night, because people were actually engaging with this data of their own free will, using their own personal time. I was very interested to see that we got something like a quarter of a million people playing the quiz within the space of 48 hours of launching it. And it sparked an enormous discussion online, on social media, which was largely dominated by people having fun with their misconceptions, which is something that I couldn't have hoped for any better, in some respects. I also liked the fact that people started sending it to politicians. How well do you know the area you claim to represent?
(ضحك)
(Laughter)
ثم في النهاية، بالعودة إلى النوعين من الناس، اعتقدت أنه سيكون مثيرًا للاهتمام حقًا أن نرى كيف أبلى الأشخاص الجيدين مع الأرقام في هذا الاختبار الخبير الإحصائي الوطني في انجلترا وويلز، جون بولينج، تتوقع أنه سيكون جيدًا جدًا، حصل على 44 لمنطقته.
And then just to finish, going back to the two kinds of people, I thought it would be really interesting to see how people who are good with numbers would do on this quiz. The national statistician of England and Wales, John Pullinger, you would expect he would be pretty good. He got 44 for his own area.
(ضحك)
(Laughter)
جيريمي باكسمان - باعتراف الجميع، بعد كوب من النبيذ - 36، أسوء حتى. يظهر لك فقط أن الأرقام يمكنها أن تلهمنا جميعًا، ويمكنها أن تفاجئنا جميعًا.
Jeremy Paxman -- admittedly, after a glass of wine -- 36. Even worse. It just shows you that the numbers can inspire us all. They can surprise us all.
حتى في كثير من الأحيان نحن نتحدث عن الإحصاء باعتباره علم عدم اليقين. فكرتي الأخيرة لهذا اليوم هي في الواقع، الإحصاء هي علم عنا، وهذا هو السبب في أننا يجب أن نكون مفتونين بالأرقام.
So very often, we talk about statistics as being the science of uncertainty. My parting thought for today is: actually, statistics is the science of us. And that's why we should be fascinated by numbers.
شكرًا جزيلًا.
Thank you very much.
(تصفيق)
(Applause)